

154
P. Jain and L. Varghese
Table 9 Median ranks of suspension system
S. No.
Time to failure (h)
Median ranks (%)
1
450
10.91
2
558.33
26.44
3
583.33
42.14
4
700
57.86
5
750
73.56
6
800
89.10
Table 10 Median ranks of suspension system
N
t
x = ln(t)
F(t)
y
x 2
y 2
x.y
1
450
6.109
0.1091
−2.158
37.319
4.657
−13.183
2
558.33
6.324
0.2644
−1.1806
39.992
1.3938
−7.466
3
583.33
6.368
0.4214
−0.603
40.551
0.3636
−3.839
4
700
6.551
0.5786
−0.146
42.915
0.0213
−0.956
5
750
6.620
0.7356
+0.285
43.824
0.0812
+1.886
6
800
6.684
0.891
+0.796
44.675
0.633
+5.320
38.656
−3.006
249.276
7.1499
−18.238
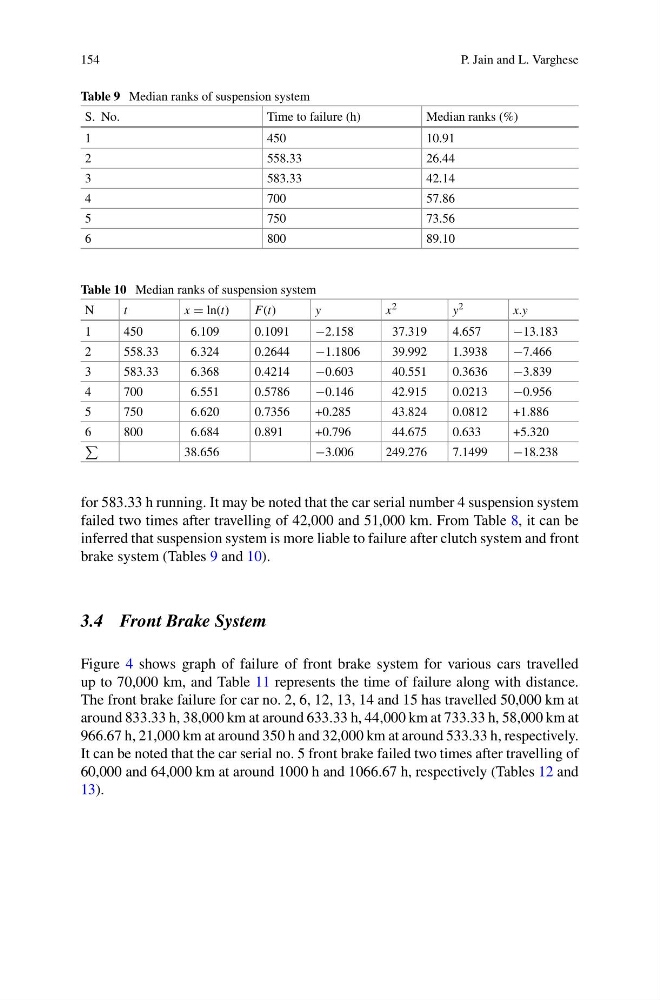
for 583.33 h running. It may be noted that the car serial number 4 suspension system
failed two times after travelling of 42,000 and 51,000 km. From Table 8, it can be
inferred that suspension system is more liable to failure after clutch system and front
brake system (Tables 9 and 10).
3.4 Front Brake System
Figure 4 shows graph of failure of front brake system for various cars travelled
up to 70,000 km, and Table 11 represents the time of failure along with distance.
The front brake failure for car no. 2, 6, 12, 13, 14 and 15 has travelled 50,000 km at
around 833.33 h, 38,000 km at around 633.33 h, 44,000 km at 733.33 h, 58,000 km at
966.67 h, 21,000 km at around 350 h and 32,000 km at around 533.33 h, respectively.
It can be noted that the car serial no. 5 front brake failed two times after travelling of
60,000 and 64,000 km at around 1000 h and 1066.67 h, respectively (Tables 12 and
13).
P. Jain and L. Varghese
Table 9 Median ranks of suspension system
S. No.
Time to failure (h)
Median ranks (%)
1
450
10.91
2
558.33
26.44
3
583.33
42.14
4
700
57.86
5
750
73.56
6
800
89.10
Table 10 Median ranks of suspension system
N
t
x = ln(t)
F(t)
y
x 2
y 2
x.y
1
450
6.109
0.1091
−2.158
37.319
4.657
−13.183
2
558.33
6.324
0.2644
−1.1806
39.992
1.3938
−7.466
3
583.33
6.368
0.4214
−0.603
40.551
0.3636
−3.839
4
700
6.551
0.5786
−0.146
42.915
0.0213
−0.956
5
750
6.620
0.7356
+0.285
43.824
0.0812
+1.886
6
800
6.684
0.891
+0.796
44.675
0.633
+5.320
38.656
−3.006
249.276
7.1499
−18.238
for 583.33 h running. It may be noted that the car serial number 4 suspension system
failed two times after travelling of 42,000 and 51,000 km. From Table 8, it can be
inferred that suspension system is more liable to failure after clutch system and front
brake system (Tables 9 and 10).
3.4 Front Brake System
Figure 4 shows graph of failure of front brake system for various cars travelled
up to 70,000 km, and Table 11 represents the time of failure along with distance.
The front brake failure for car no. 2, 6, 12, 13, 14 and 15 has travelled 50,000 km at
around 833.33 h, 38,000 km at around 633.33 h, 44,000 km at 733.33 h, 58,000 km at
966.67 h, 21,000 km at around 350 h and 32,000 km at around 533.33 h, respectively.
It can be noted that the car serial no. 5 front brake failed two times after travelling of
60,000 and 64,000 km at around 1000 h and 1066.67 h, respectively (Tables 12 and
13).