

Reliability Analysis of Car Subsystem by Weibull …
153
Table 7 Calculation table of rear brake system
N
t
x = ln(t)
F(t)
y
x 2
y 2
x.y
1
483.33
6.18
0.1093
−2.158
38.19
4.65
−13.38
2
650
6.477
0.2636
−1.175
41.95
1.38
−7.61
3
666.67
6.502
0.4218
−0.601
42.27
0.361
−3.907
4
750
6.62
0.5781
−0.147
43.82
0.021
−0.973
5
1000
6.90
0.7341
+0.281
47.61
0.079
+1.938
6
1233.33
7.11
0.8906
+0.794
50.55
0.6308
+5.645
39.79
−3.006
264.39
7.121
−18.24
3.3 Suspension System
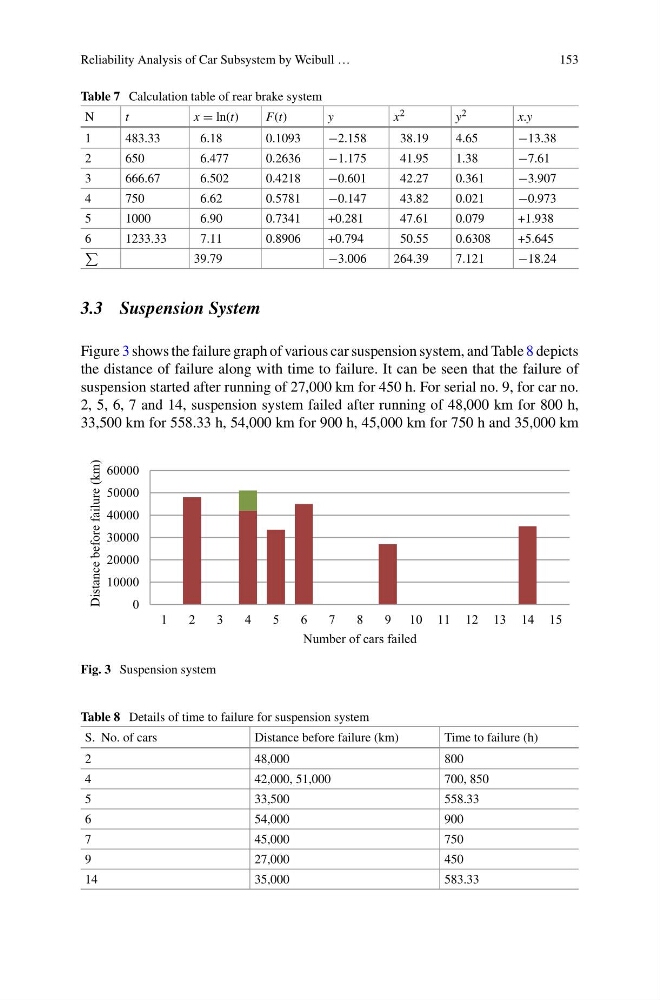
Figure 3 shows the failure graph of various car suspension system, and Table 8 depicts
the distance of failure along with time to failure. It can be seen that the failure of
suspension started after running of 27,000 km for 450 h. For serial no. 9, for car no.
2, 5, 6, 7 and 14, suspension system failed after running of 48,000 km for 800 h,
33,500 km for 558.33 h, 54,000 km for 900 h, 45,000 km for 750 h and 35,000 km
0
10000
20000
30000
40000
50000
60000
1
2
3
4
5
6
7
8
9 10 11 12 13 14 15
Distance before failure (km)
Number of cars failed
Fig. 3 Suspension system
Table 8 Details of time to failure for suspension system
S. No. of cars
Distance before failure (km)
Time to failure (h)
2
48,000
800
4
42,000, 51,000
700, 850
5
33,500
558.33
6
54,000
900
7
45,000
750
9
27,000
450
14
35,000
583.33
153
Table 7 Calculation table of rear brake system
N
t
x = ln(t)
F(t)
y
x 2
y 2
x.y
1
483.33
6.18
0.1093
−2.158
38.19
4.65
−13.38
2
650
6.477
0.2636
−1.175
41.95
1.38
−7.61
3
666.67
6.502
0.4218
−0.601
42.27
0.361
−3.907
4
750
6.62
0.5781
−0.147
43.82
0.021
−0.973
5
1000
6.90
0.7341
+0.281
47.61
0.079
+1.938
6
1233.33
7.11
0.8906
+0.794
50.55
0.6308
+5.645
39.79
−3.006
264.39
7.121
−18.24
3.3 Suspension System
Figure 3 shows the failure graph of various car suspension system, and Table 8 depicts
the distance of failure along with time to failure. It can be seen that the failure of
suspension started after running of 27,000 km for 450 h. For serial no. 9, for car no.
2, 5, 6, 7 and 14, suspension system failed after running of 48,000 km for 800 h,
33,500 km for 558.33 h, 54,000 km for 900 h, 45,000 km for 750 h and 35,000 km
0
10000
20000
30000
40000
50000
60000
1
2
3
4
5
6
7
8
9 10 11 12 13 14 15
Distance before failure (km)
Number of cars failed
Fig. 3 Suspension system
Table 8 Details of time to failure for suspension system
S. No. of cars
Distance before failure (km)
Time to failure (h)
2
48,000
800
4
42,000, 51,000
700, 850
5
33,500
558.33
6
54,000
900
7
45,000
750
9
27,000
450
14
35,000
583.33