

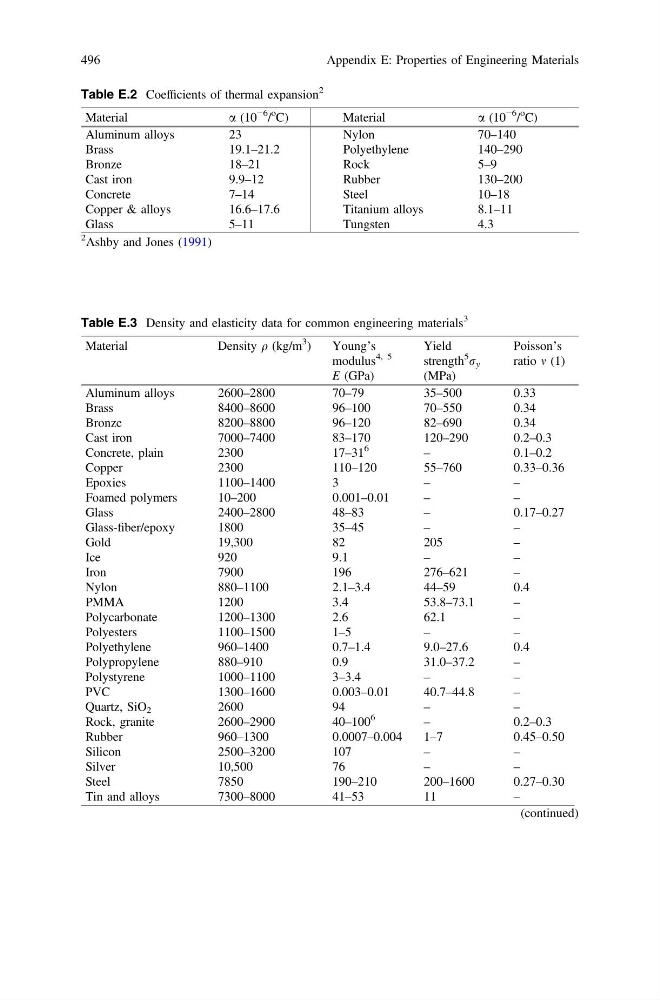
Table E.2 Coefficients of thermal expansion
2
Material
a (10
−6
/
o
C)
Material
a (10
−6
/
o
C)
Aluminum alloys
23
Nylon
70–140
Brass
19.1–21.2
Polyethylene
140–290
Bronze
18–21
Rock
5–9
Cast iron
9.9–12
Rubber
130–200
Concrete
7–14
Steel
10–18
Copper & alloys
16.6–17.6
Titanium alloys
8.1–11
Glass
5–11
Tungsten
4.3
2
Ashby and Jones (1991)
Table E.3 Density and elasticity data for common engineering materials
3
Material
Density q (kg/m
3
)
Young’s
modulus
4, 5
E (GPa)
Yield
strength
5
r y
(MPa)
Poisson’s
ratio m (1)
Aluminum alloys
2600–2800
70–79
35–500
0.33
Brass
8400–8600
96–100
70–550
0.34
Bronze
8200–8800
96–120
82–690
0.34
Cast iron
7000–7400
83–170
120–290
0.2–0.3
Concrete, plain
2300
17–31
6
–
0.1–0.2
Copper
2300
110–120
55–760
0.33–0.36
Epoxies
1100–1400
3
–
–
Foamed polymers
10–200
0.001–0.01
–
–
Glass
2400–2800
48–83
–
0.17–0.27
Glass-fiber/epoxy
1800
35–45
–
–
Gold
19,300
82
205
–
Ice
920
9.1
–
–
Iron
7900
196
276–621
–
Nylon
880–1100
2.1–3.4
44–59
0.4
PMMA
1200
3.4
53.8–73.1
–
Polycarbonate
1200–1300
2.6
62.1
–
Polyesters
1100–1500
1–5
–
–
Polyethylene
960–1400
0.7–1.4
9.0–27.6
0.4
Polypropylene
880–910
0.9
31.0–37.2
–
Polystyrene
1000–1100
3–3.4
–
–
PVC
1300–1600
0.003–0.01
40.7–44.8
–
Quartz, SiO 2
2600
94
–
–
Rock, granite
2600–2900
40–100
6
–
0.2–0.3
Rubber
960–1300
0.0007–0.004
1–7
0.45–0.50
Silicon
2500–3200
107
–
–
Silver
10,500
76
–
–
Steel
7850
190–210
200–1600
0.27–0.30
Tin and alloys
7300–8000
41–53
11
–
(continued)
496
Appendix E: Properties of Engineering Materials
2
Material
a (10
−6
/
o
C)
Material
a (10
−6
/
o
C)
Aluminum alloys
23
Nylon
70–140
Brass
19.1–21.2
Polyethylene
140–290
Bronze
18–21
Rock
5–9
Cast iron
9.9–12
Rubber
130–200
Concrete
7–14
Steel
10–18
Copper & alloys
16.6–17.6
Titanium alloys
8.1–11
Glass
5–11
Tungsten
4.3
2
Ashby and Jones (1991)
Table E.3 Density and elasticity data for common engineering materials
3
Material
Density q (kg/m
3
)
Young’s
modulus
4, 5
E (GPa)
Yield
strength
5
r y
(MPa)
Poisson’s
ratio m (1)
Aluminum alloys
2600–2800
70–79
35–500
0.33
Brass
8400–8600
96–100
70–550
0.34
Bronze
8200–8800
96–120
82–690
0.34
Cast iron
7000–7400
83–170
120–290
0.2–0.3
Concrete, plain
2300
17–31
6
–
0.1–0.2
Copper
2300
110–120
55–760
0.33–0.36
Epoxies
1100–1400
3
–
–
Foamed polymers
10–200
0.001–0.01
–
–
Glass
2400–2800
48–83
–
0.17–0.27
Glass-fiber/epoxy
1800
35–45
–
–
Gold
19,300
82
205
–
Ice
920
9.1
–
–
Iron
7900
196
276–621
–
Nylon
880–1100
2.1–3.4
44–59
0.4
PMMA
1200
3.4
53.8–73.1
–
Polycarbonate
1200–1300
2.6
62.1
–
Polyesters
1100–1500
1–5
–
–
Polyethylene
960–1400
0.7–1.4
9.0–27.6
0.4
Polypropylene
880–910
0.9
31.0–37.2
–
Polystyrene
1000–1100
3–3.4
–
–
PVC
1300–1600
0.003–0.01
40.7–44.8
–
Quartz, SiO 2
2600
94
–
–
Rock, granite
2600–2900
40–100
6
–
0.2–0.3
Rubber
960–1300
0.0007–0.004
1–7
0.45–0.50
Silicon
2500–3200
107
–
–
Silver
10,500
76
–
–
Steel
7850
190–210
200–1600
0.27–0.30
Tin and alloys
7300–8000
41–53
11
–
(continued)
496
Appendix E: Properties of Engineering Materials