

82
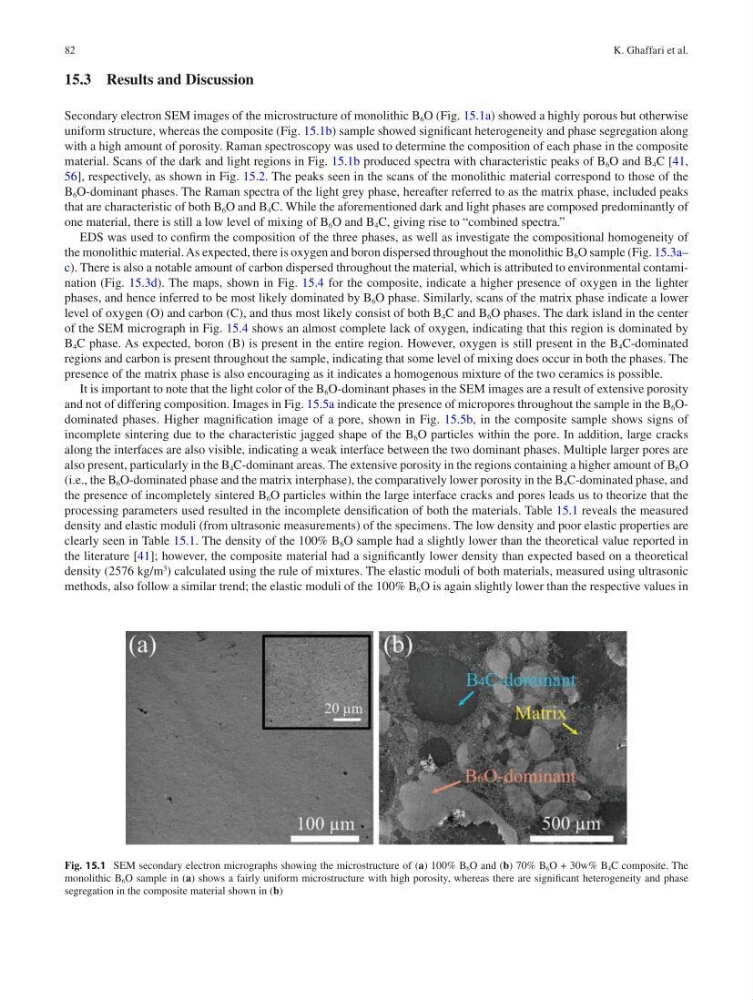
Fig. 15.1 SEM secondary electron micrographs showing the microstructure of (a) 100% B 6 O and (b) 70% B 6 O + 30w% B 4 C composite. The
monolithic B 6 O sample in (a) shows a fairly uniform microstructure with high porosity, whereas there are significant heterogeneity and phase
segregation in the composite material shown in (b)
15.3 Results and Discussion
Secondary electron SEM images of the microstructure of monolithic B 6 O (Fig. 15.1a) showed a highly porous but otherwise
uniform structure, whereas the composite (Fig. 15.1b) sample showed significant heterogeneity and phase segregation along
with a high amount of porosity. Raman spectroscopy was used to determine the composition of each phase in the composite
material. Scans of the dark and light regions in Fig. 15.1b produced spectra with characteristic peaks of B 6 O and B 4 C [41,
56], respectively, as shown in Fig. 15.2. The peaks seen in the scans of the monolithic material correspond to those of the
B 6 O-dominant phases. The Raman spectra of the light grey phase, hereafter referred to as the matrix phase, included peaks
that are characteristic of both B 6 O and B 4 C. While the aforementioned dark and light phases are composed predominantly of
one material, there is still a low level of mixing of B 6 O and B 4 C, giving rise to “combined spectra.”
EDS was used to confirm the composition of the three phases, as well as investigate the compositional homogeneity of
the monolithic material. As expected, there is oxygen and boron dispersed throughout the monolithic B 6 O sample (Fig. 15.3a–
c). There is also a notable amount of carbon dispersed throughout the material, which is attributed to environmental contamination (Fig. 15.3d). The maps, shown in Fig. 15.4 for the composite, indicate a higher presence of oxygen in the lighter
phases, and hence inferred to be most likely dominated by B 6 O phase. Similarly, scans of the matrix phase indicate a lower
level of oxygen (O) and carbon (C), and thus most likely consist of both B 4 C and B 6 O phases. The dark island in the center
of the SEM micrograph in Fig. 15.4 shows an almost complete lack of oxygen, indicating that this region is dominated by
B 4 C phase. As expected, boron (B) is present in the entire region. However, oxygen is still present in the B 4 C-dominated
regions and carbon is present throughout the sample, indicating that some level of mixing does occur in both the phases. The
presence of the matrix phase is also encouraging as it indicates a homogenous mixture of the two ceramics is possible.
It is important to note that the light color of the B 6 O- dominant phases in the SEM images are a result of extensive porosity
and not of differing composition. Images in Fig. 15.5a indicate the presence of micropores throughout the sample in the B 6 Odominated phases. Higher magnification image of a pore, shown in Fig. 15.5b, in the composite sample shows signs of
incomplete sintering due to the characteristic jagged shape of the B 6 O particles within the pore. In addition, large cracks
along the interfaces are also visible, indicating a weak interface between the two dominant phases. Multiple larger pores are
also present, particularly in the B 4 C-dominant areas. The extensive porosity in the regions containing a higher amount of B 6 O
(i.e., the B 6 O- dominated phase and the matrix interphase), the comparatively lower porosity in the B 4 C-dominated phase, and
the presence of incompletely sintered B 6 O particles within the large interface cracks and pores leads us to theorize that the
processing parameters used resulted in the incomplete densification of both the materials. Table 15.1 reveals the measured
density and elastic moduli (from ultrasonic measurements) of the specimens. The low density and poor elastic properties are
clearly seen in Table 15.1. The density of the 100% B 6 O sample had a slightly lower than the theoretical value reported in
the literature [41]; however, the composite material had a significantly lower density than expected based on a theoretical
density (2576 kg/m
3
) calculated using the rule of mixtures. The elastic moduli of both materials, measured using ultrasonic
methods, also follow a similar trend; the elastic moduli of the 100% B 6 O is again slightly lower than the respective values in
K. Ghaffari et al.
Fig. 15.1 SEM secondary electron micrographs showing the microstructure of (a) 100% B 6 O and (b) 70% B 6 O + 30w% B 4 C composite. The
monolithic B 6 O sample in (a) shows a fairly uniform microstructure with high porosity, whereas there are significant heterogeneity and phase
segregation in the composite material shown in (b)
15.3 Results and Discussion
Secondary electron SEM images of the microstructure of monolithic B 6 O (Fig. 15.1a) showed a highly porous but otherwise
uniform structure, whereas the composite (Fig. 15.1b) sample showed significant heterogeneity and phase segregation along
with a high amount of porosity. Raman spectroscopy was used to determine the composition of each phase in the composite
material. Scans of the dark and light regions in Fig. 15.1b produced spectra with characteristic peaks of B 6 O and B 4 C [41,
56], respectively, as shown in Fig. 15.2. The peaks seen in the scans of the monolithic material correspond to those of the
B 6 O-dominant phases. The Raman spectra of the light grey phase, hereafter referred to as the matrix phase, included peaks
that are characteristic of both B 6 O and B 4 C. While the aforementioned dark and light phases are composed predominantly of
one material, there is still a low level of mixing of B 6 O and B 4 C, giving rise to “combined spectra.”
EDS was used to confirm the composition of the three phases, as well as investigate the compositional homogeneity of
the monolithic material. As expected, there is oxygen and boron dispersed throughout the monolithic B 6 O sample (Fig. 15.3a–
c). There is also a notable amount of carbon dispersed throughout the material, which is attributed to environmental contamination (Fig. 15.3d). The maps, shown in Fig. 15.4 for the composite, indicate a higher presence of oxygen in the lighter
phases, and hence inferred to be most likely dominated by B 6 O phase. Similarly, scans of the matrix phase indicate a lower
level of oxygen (O) and carbon (C), and thus most likely consist of both B 4 C and B 6 O phases. The dark island in the center
of the SEM micrograph in Fig. 15.4 shows an almost complete lack of oxygen, indicating that this region is dominated by
B 4 C phase. As expected, boron (B) is present in the entire region. However, oxygen is still present in the B 4 C-dominated
regions and carbon is present throughout the sample, indicating that some level of mixing does occur in both the phases. The
presence of the matrix phase is also encouraging as it indicates a homogenous mixture of the two ceramics is possible.
It is important to note that the light color of the B 6 O- dominant phases in the SEM images are a result of extensive porosity
and not of differing composition. Images in Fig. 15.5a indicate the presence of micropores throughout the sample in the B 6 Odominated phases. Higher magnification image of a pore, shown in Fig. 15.5b, in the composite sample shows signs of
incomplete sintering due to the characteristic jagged shape of the B 6 O particles within the pore. In addition, large cracks
along the interfaces are also visible, indicating a weak interface between the two dominant phases. Multiple larger pores are
also present, particularly in the B 4 C-dominant areas. The extensive porosity in the regions containing a higher amount of B 6 O
(i.e., the B 6 O- dominated phase and the matrix interphase), the comparatively lower porosity in the B 4 C-dominated phase, and
the presence of incompletely sintered B 6 O particles within the large interface cracks and pores leads us to theorize that the
processing parameters used resulted in the incomplete densification of both the materials. Table 15.1 reveals the measured
density and elastic moduli (from ultrasonic measurements) of the specimens. The low density and poor elastic properties are
clearly seen in Table 15.1. The density of the 100% B 6 O sample had a slightly lower than the theoretical value reported in
the literature [41]; however, the composite material had a significantly lower density than expected based on a theoretical
density (2576 kg/m
3
) calculated using the rule of mixtures. The elastic moduli of both materials, measured using ultrasonic
methods, also follow a similar trend; the elastic moduli of the 100% B 6 O is again slightly lower than the respective values in
K. Ghaffari et al.