

74
with the data remained. Warnes et al. [7] utilized VISAR [8] to measure the ring surface velocity, avoiding some of the difficulties of the data reduction process. They published data on 6061 aluminum and copper of various hardness. Later Warnes
et al. [9] examined the effect of shock hardening on the ring tension data.
In this work, I used continuum scale modeling and simulation to explore different configurations of this experiment. I
chose a geometry derived from Warnes et al. [7], I came into possession of Warnes et al. [9] shortly before publication, but
I elected to include a copper tube to direct explosive gasses laterally and to simplify fixturing the experiment. I also chose to
contain the explosive in a separate plastic sleeve for ease of assembly. I examined the effect of features such as copper tube
thickness size of the explosive column, and the geometry of the ring on the resulting ring velocity history.
14.2 Modeling and Simulation Setup
In order to explore many different iterations of the experimental setup in a reasonable time frame, I elected to use the
ALEGRA hydrocode [10] to conduct 2D axisymmetric simulations. In the case of metallic sample rings, this should prove
sufficiently accurate to parametrically study the ring geometry, though it prohibits modeling certain experimental issues
which violate that symmetry such as nonconcentric sample ring placement.
A number of different material models were used in this work. I used the Johnson-Cook strength and fracture models for
all materials except the copper tube and maraging 350 steel driver, for which I used the Steinberg-Guinan-Lund constitutive
model and the Johnson-Cook fracture model. The explosive sleeve was modeled as polyvinyl chloride. The rings were modeled as either OFHC copper or 6061-T6 aluminum. The Maraging 350 steel driver was given a yield strength of 308 ksi. A
Jones-Wilkins-Lee equation of state model was used to model the explosive as composition C4; no strength model was used.
Sesame tables, provided with the ALEGRA distribution, were used for the other materials except the plastic which was modeled using a Mie-Grüneisen equation of state. Model constants were taken from the provided library of values. Interested
readers should consult the ALEGRA documentation [10] for further details.
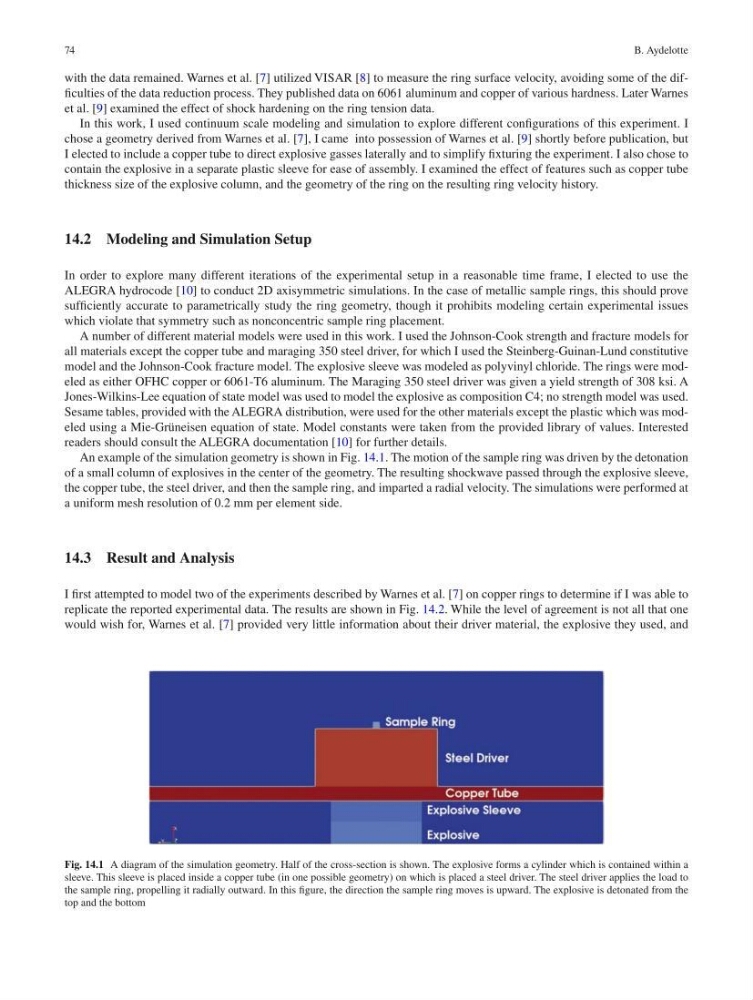
An example of the simulation geometry is shown in Fig. 14.1. The motion of the sample ring was driven by the detonation
of a small column of explosives in the center of the geometry. The resulting shockwave passed through the explosive sleeve,
the copper tube, the steel driver, and then the sample ring, and imparted a radial velocity. The simulations were performed at
a uniform mesh resolution of 0.2 mm per element side.
14.3 Result and Analysis
I first attempted to model two of the experiments described by Warnes et al. [7] on copper rings to determine if I was able to
replicate the reported experimental data. The results are shown in Fig. 14.2. While the level of agreement is not all that one
would wish for, Warnes et al. [7] provided very little information about their driver material, the explosive they used, and
Fig. 14.1 A diagram of the simulation geometry. Half of the cross- section is shown. The explosive forms a cylinder which is contained within a
sleeve. This sleeve is placed inside a copper tube (in one possible geometry) on which is placed a steel driver. The steel driver applies the load to
the sample ring, propelling it radially outward. In this figure, the direction the sample ring moves is upward. The explosive is detonated from the
top and the bottom
B. Aydelotte
with the data remained. Warnes et al. [7] utilized VISAR [8] to measure the ring surface velocity, avoiding some of the difficulties of the data reduction process. They published data on 6061 aluminum and copper of various hardness. Later Warnes
et al. [9] examined the effect of shock hardening on the ring tension data.
In this work, I used continuum scale modeling and simulation to explore different configurations of this experiment. I
chose a geometry derived from Warnes et al. [7], I came into possession of Warnes et al. [9] shortly before publication, but
I elected to include a copper tube to direct explosive gasses laterally and to simplify fixturing the experiment. I also chose to
contain the explosive in a separate plastic sleeve for ease of assembly. I examined the effect of features such as copper tube
thickness size of the explosive column, and the geometry of the ring on the resulting ring velocity history.
14.2 Modeling and Simulation Setup
In order to explore many different iterations of the experimental setup in a reasonable time frame, I elected to use the
ALEGRA hydrocode [10] to conduct 2D axisymmetric simulations. In the case of metallic sample rings, this should prove
sufficiently accurate to parametrically study the ring geometry, though it prohibits modeling certain experimental issues
which violate that symmetry such as nonconcentric sample ring placement.
A number of different material models were used in this work. I used the Johnson-Cook strength and fracture models for
all materials except the copper tube and maraging 350 steel driver, for which I used the Steinberg-Guinan-Lund constitutive
model and the Johnson-Cook fracture model. The explosive sleeve was modeled as polyvinyl chloride. The rings were modeled as either OFHC copper or 6061-T6 aluminum. The Maraging 350 steel driver was given a yield strength of 308 ksi. A
Jones-Wilkins-Lee equation of state model was used to model the explosive as composition C4; no strength model was used.
Sesame tables, provided with the ALEGRA distribution, were used for the other materials except the plastic which was modeled using a Mie-Grüneisen equation of state. Model constants were taken from the provided library of values. Interested
readers should consult the ALEGRA documentation [10] for further details.
An example of the simulation geometry is shown in Fig. 14.1. The motion of the sample ring was driven by the detonation
of a small column of explosives in the center of the geometry. The resulting shockwave passed through the explosive sleeve,
the copper tube, the steel driver, and then the sample ring, and imparted a radial velocity. The simulations were performed at
a uniform mesh resolution of 0.2 mm per element side.
14.3 Result and Analysis
I first attempted to model two of the experiments described by Warnes et al. [7] on copper rings to determine if I was able to
replicate the reported experimental data. The results are shown in Fig. 14.2. While the level of agreement is not all that one
would wish for, Warnes et al. [7] provided very little information about their driver material, the explosive they used, and
Fig. 14.1 A diagram of the simulation geometry. Half of the cross- section is shown. The explosive forms a cylinder which is contained within a
sleeve. This sleeve is placed inside a copper tube (in one possible geometry) on which is placed a steel driver. The steel driver applies the load to
the sample ring, propelling it radially outward. In this figure, the direction the sample ring moves is upward. The explosive is detonated from the
top and the bottom
B. Aydelotte