

61
11.3 Representative Results
Preliminary acoustic chirp tests were completed with two earplugs having different attenuation ratings and microstructures.
Displayed in Fig. 11.4 are the results, showing the two earplugs overlaid with the control test of setup with no earplug
inserted. It is apparent the two earplugs perform almost identically in the 1–4 kHz range and again in the 8–10 kHz range but
have differing responses in the mid-frequency range, 4–8 kHz. In the 4–8 kHz range, the frequency response of the two
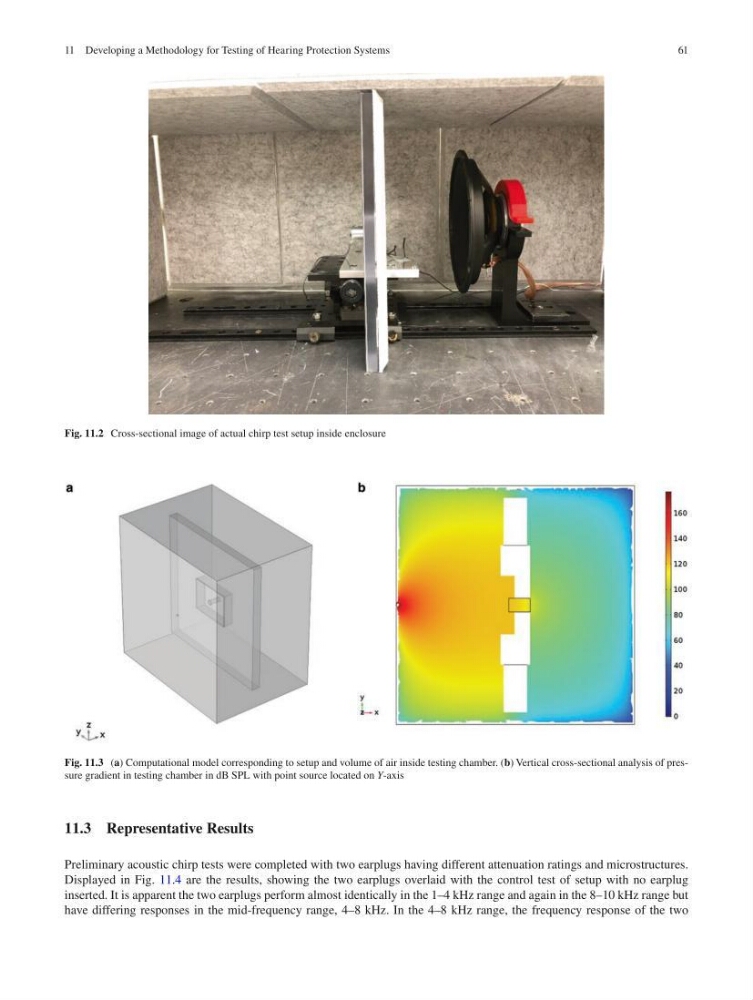
Fig. 11.3 (a) Computational model corresponding to setup and volume of air inside testing chamber. (b) Vertical cross-sectional analysis of pressure gradient in testing chamber in dB SPL with point source located on Y-axis
Fig. 11.2 Cross-sectional image of actual chirp test setup inside enclosure
11 Developing a Methodology for Testing of Hearing Protection Systems
11.3 Representative Results
Preliminary acoustic chirp tests were completed with two earplugs having different attenuation ratings and microstructures.
Displayed in Fig. 11.4 are the results, showing the two earplugs overlaid with the control test of setup with no earplug
inserted. It is apparent the two earplugs perform almost identically in the 1–4 kHz range and again in the 8–10 kHz range but
have differing responses in the mid-frequency range, 4–8 kHz. In the 4–8 kHz range, the frequency response of the two
Fig. 11.3 (a) Computational model corresponding to setup and volume of air inside testing chamber. (b) Vertical cross-sectional analysis of pressure gradient in testing chamber in dB SPL with point source located on Y-axis
Fig. 11.2 Cross-sectional image of actual chirp test setup inside enclosure
11 Developing a Methodology for Testing of Hearing Protection Systems