

60
11.2 Methods
We are investigating passive hearing protection by first considering samples with various Noise Reduction Ratings (NRR),
materials, and costs. With our selected samples, our first goal was to gain an accurate analysis of their linear performance.
Using 1–10 kHz chirp signals from a well- characterized speaker at a level of about 75 dB SPL as our stimulus, we measured
the Frequency Response Function (FRF) of each of our samples. This function presents the ratio of output/input of a system
and allows for an understanding of how various earplugs attenuate at a range of frequencies. The output and input values
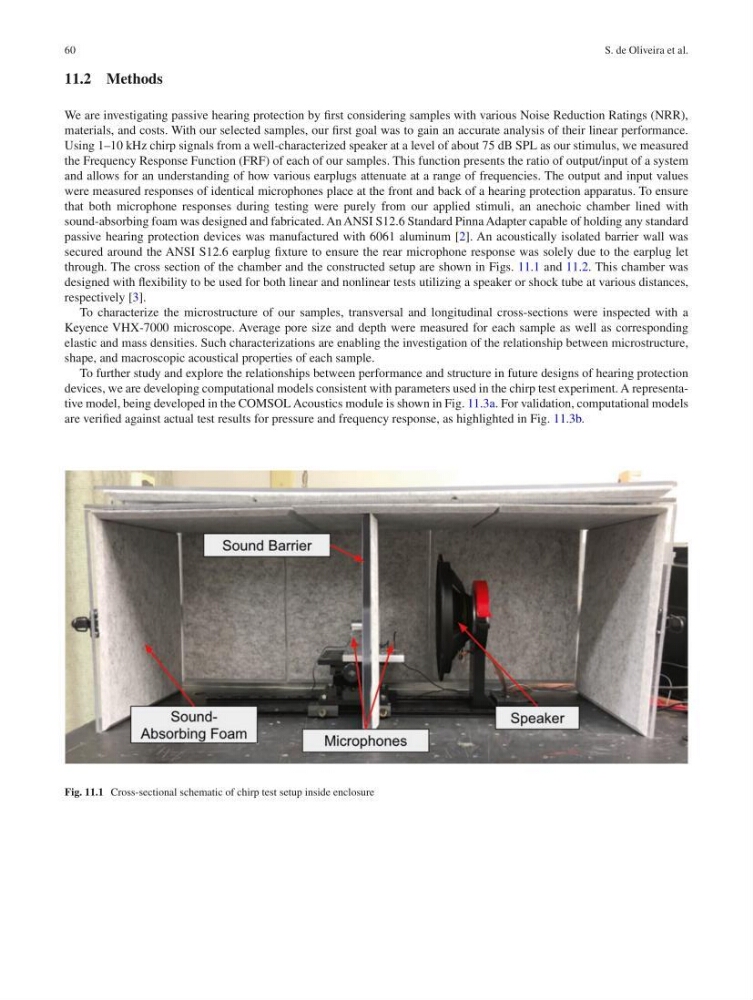
were measured responses of identical microphones place at the front and back of a hearing protection apparatus. To ensure
that both microphone responses during testing were purely from our applied stimuli, an anechoic chamber lined with
sound- absorbing foam was designed and fabricated. An ANSI S12.6 Standard Pinna Adapter capable of holding any standard
passive hearing protection devices was manufactured with 6061 aluminum [2]. An acoustically isolated barrier wall was
secured around the ANSI S12.6 earplug fixture to ensure the rear microphone response was solely due to the earplug let
through. The cross section of the chamber and the constructed setup are shown in Figs. 11.1 and 11.2. This chamber was
designed with flexibility to be used for both linear and nonlinear tests utilizing a speaker or shock tube at various distances,
respectively [3].
To characterize the microstructure of our samples, transversal and longitudinal cross-sections were inspected with a
Keyence VHX-7000 microscope. Average pore size and depth were measured for each sample as well as corresponding
elastic and mass densities. Such characterizations are enabling the investigation of the relationship between microstructure,
shape, and macroscopic acoustical properties of each sample.
To further study and explore the relationships between performance and structure in future designs of hearing protection
devices, we are developing computational models consistent with parameters used in the chirp test experiment. A representative model, being developed in the COMSOL Acoustics module is shown in Fig. 11.3a. For validation, computational models
are verified against actual test results for pressure and frequency response, as highlighted in Fig. 11.3b.
Fig. 11.1 Cross-sectional schematic of chirp test setup inside enclosure
S. de Oliveira et al.
11.2 Methods
We are investigating passive hearing protection by first considering samples with various Noise Reduction Ratings (NRR),
materials, and costs. With our selected samples, our first goal was to gain an accurate analysis of their linear performance.
Using 1–10 kHz chirp signals from a well- characterized speaker at a level of about 75 dB SPL as our stimulus, we measured
the Frequency Response Function (FRF) of each of our samples. This function presents the ratio of output/input of a system
and allows for an understanding of how various earplugs attenuate at a range of frequencies. The output and input values
were measured responses of identical microphones place at the front and back of a hearing protection apparatus. To ensure
that both microphone responses during testing were purely from our applied stimuli, an anechoic chamber lined with
sound- absorbing foam was designed and fabricated. An ANSI S12.6 Standard Pinna Adapter capable of holding any standard
passive hearing protection devices was manufactured with 6061 aluminum [2]. An acoustically isolated barrier wall was
secured around the ANSI S12.6 earplug fixture to ensure the rear microphone response was solely due to the earplug let
through. The cross section of the chamber and the constructed setup are shown in Figs. 11.1 and 11.2. This chamber was
designed with flexibility to be used for both linear and nonlinear tests utilizing a speaker or shock tube at various distances,
respectively [3].
To characterize the microstructure of our samples, transversal and longitudinal cross-sections were inspected with a
Keyence VHX-7000 microscope. Average pore size and depth were measured for each sample as well as corresponding
elastic and mass densities. Such characterizations are enabling the investigation of the relationship between microstructure,
shape, and macroscopic acoustical properties of each sample.
To further study and explore the relationships between performance and structure in future designs of hearing protection
devices, we are developing computational models consistent with parameters used in the chirp test experiment. A representative model, being developed in the COMSOL Acoustics module is shown in Fig. 11.3a. For validation, computational models
are verified against actual test results for pressure and frequency response, as highlighted in Fig. 11.3b.
Fig. 11.1 Cross-sectional schematic of chirp test setup inside enclosure
S. de Oliveira et al.