

53
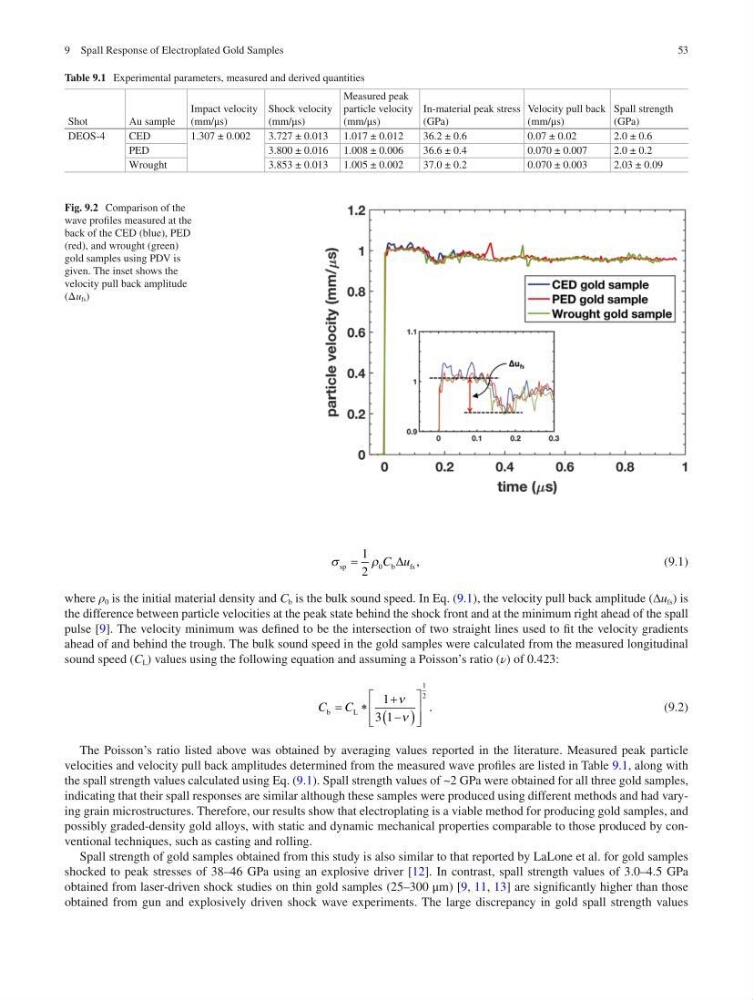
Fig. 9.2 Comparison of the
wave profiles measured at the
back of the CED (blue), PED
(red), and wrought (green)
gold samples using PDV is
given. The inset shows the
velocity pull back amplitude
(Δu fs )
σ
ρ
sp
b
f s
=
1
2
0 C u
∆ ,
(9.1)
where ρ 0 is the initial material density and C b is the bulk sound speed. In Eq. (9.1), the velocity pull back amplitude (∆u fs ) is
the difference between particle velocities at the peak state behind the shock front and at the minimum right ahead of the spall
pulse [9]. The velocity minimum was defined to be the intersection of two straight lines used to fit the velocity gradients
ahead of and behind the trough. The bulk sound speed in the gold samples were calculated from the measured longitudinal
sound speed (C L ) values using the following equation and assuming a Poisson’s ratio (ν) of 0.423:
C C
b
L
=
∗
+
−
( )
1
3 1
1
2
ν
ν
.
(9.2)
The Poisson’s ratio listed above was obtained by averaging values reported in the literature. Measured peak particle
velocities and velocity pull back amplitudes determined from the measured wave profiles are listed in Table 9.1, along with
the spall strength values calculated using Eq. (9.1). Spall strength values of ~2 GPa were obtained for all three gold samples,
indicating that their spall responses are similar although these samples were produced using different methods and had varying grain microstructures. Therefore, our results show that electroplating is a viable method for producing gold samples, and
possibly graded- density gold alloys, with static and dynamic mechanical properties comparable to those produced by conventional techniques, such as casting and rolling.
Spall strength of gold samples obtained from this study is also similar to that reported by LaLone et al. for gold samples
shocked to peak stresses of 38–46 GPa using an explosive driver [12]. In contrast, spall strength values of 3.0–4.5 GPa
obtained from laser-driven shock studies on thin gold samples (25–300 μm) [9, 11, 13] are significantly higher than those
obtained from gun and explosively driven shock wave experiments. The large discrepancy in gold spall strength values
Table 9.1 Experimental parameters, measured and derived quantities
Shot
Au sample
Impact velocity
(mm/μs)
Shock velocity
(mm/μs)
Measured peak
particle velocity
(mm/μs)
In-material peak stress
(GPa)
Velocity pull back
(mm/μs)
Spall strength
(GPa)
DEOS-4
CED
1.307 ± 0.002
3.727 ± 0.013 1.017 ± 0.012
36.2 ± 0.6
0.07 ± 0.02
2.0 ± 0.6
PED
3.800 ± 0.016 1.008 ± 0.006
36.6 ± 0.4
0.070 ± 0.007
2.0 ± 0.2
Wrought
3.853 ± 0.013 1.005 ± 0.002
37.0 ± 0.2
0.070 ± 0.003
2.03 ± 0.09
9 Spall Response of Electroplated Gold Samples
Fig. 9.2 Comparison of the
wave profiles measured at the
back of the CED (blue), PED
(red), and wrought (green)
gold samples using PDV is
given. The inset shows the
velocity pull back amplitude
(Δu fs )
σ
ρ
sp
b
f s
=
1
2
0 C u
∆ ,
(9.1)
where ρ 0 is the initial material density and C b is the bulk sound speed. In Eq. (9.1), the velocity pull back amplitude (∆u fs ) is
the difference between particle velocities at the peak state behind the shock front and at the minimum right ahead of the spall
pulse [9]. The velocity minimum was defined to be the intersection of two straight lines used to fit the velocity gradients
ahead of and behind the trough. The bulk sound speed in the gold samples were calculated from the measured longitudinal
sound speed (C L ) values using the following equation and assuming a Poisson’s ratio (ν) of 0.423:
C C
b
L
=
∗
+
−
( )
1
3 1
1
2
ν
ν
.
(9.2)
The Poisson’s ratio listed above was obtained by averaging values reported in the literature. Measured peak particle
velocities and velocity pull back amplitudes determined from the measured wave profiles are listed in Table 9.1, along with
the spall strength values calculated using Eq. (9.1). Spall strength values of ~2 GPa were obtained for all three gold samples,
indicating that their spall responses are similar although these samples were produced using different methods and had varying grain microstructures. Therefore, our results show that electroplating is a viable method for producing gold samples, and
possibly graded- density gold alloys, with static and dynamic mechanical properties comparable to those produced by conventional techniques, such as casting and rolling.
Spall strength of gold samples obtained from this study is also similar to that reported by LaLone et al. for gold samples
shocked to peak stresses of 38–46 GPa using an explosive driver [12]. In contrast, spall strength values of 3.0–4.5 GPa
obtained from laser-driven shock studies on thin gold samples (25–300 μm) [9, 11, 13] are significantly higher than those
obtained from gun and explosively driven shock wave experiments. The large discrepancy in gold spall strength values
Table 9.1 Experimental parameters, measured and derived quantities
Shot
Au sample
Impact velocity
(mm/μs)
Shock velocity
(mm/μs)
Measured peak
particle velocity
(mm/μs)
In-material peak stress
(GPa)
Velocity pull back
(mm/μs)
Spall strength
(GPa)
DEOS-4
CED
1.307 ± 0.002
3.727 ± 0.013 1.017 ± 0.012
36.2 ± 0.6
0.07 ± 0.02
2.0 ± 0.6
PED
3.800 ± 0.016 1.008 ± 0.006
36.6 ± 0.4
0.070 ± 0.007
2.0 ± 0.2
Wrought
3.853 ± 0.013 1.005 ± 0.002
37.0 ± 0.2
0.070 ± 0.003
2.03 ± 0.09
9 Spall Response of Electroplated Gold Samples