

31
6.3 Results
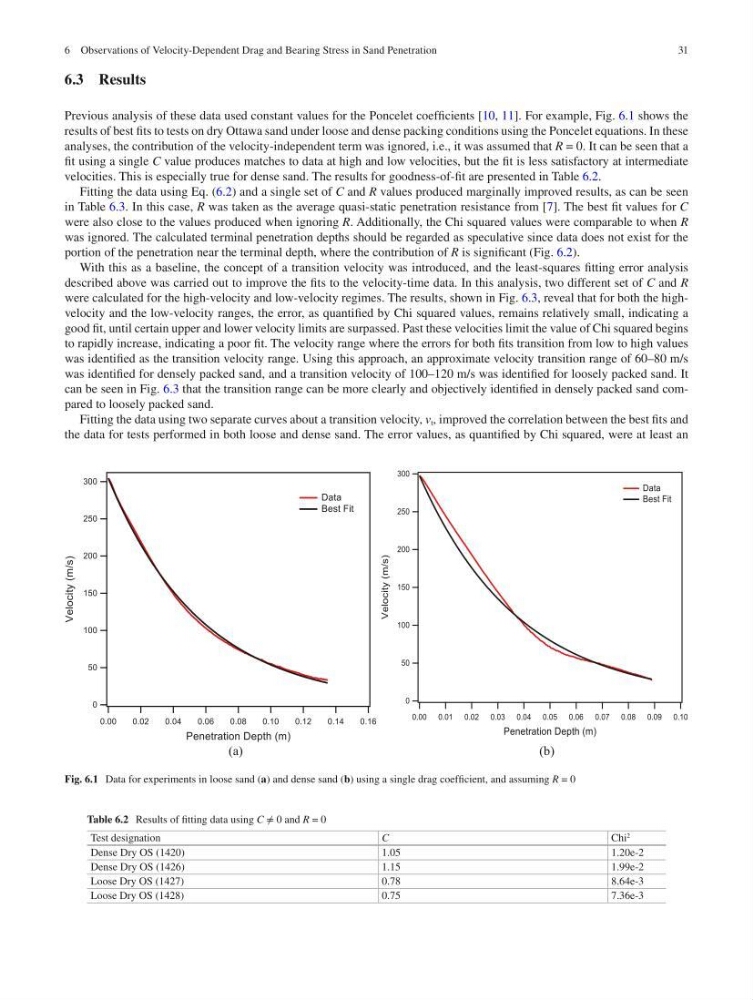
Previous analysis of these data used constant values for the Poncelet coefficients [10, 11]. For example, Fig. 6.1 shows the
results of best fits to tests on dry Ottawa sand under loose and dense packing conditions using the Poncelet equations. In these
analyses, the contribution of the velocity- independent term was ignored, i.e., it was assumed that R = 0. It can be seen that a
fit using a single C value produces matches to data at high and low velocities, but the fit is less satisfactory at intermediate
velocities. This is especially true for dense sand. The results for goodness-of-fit are presented in Table 6.2.
Fitting the data using Eq. (6.2) and a single set of C and R values produced marginally improved results, as can be seen
in Table 6.3. In this case, R was taken as the average quasi- static penetration resistance from [7]. The best fit values for C
were also close to the values produced when ignoring R. Additionally, the Chi squared values were comparable to when R
was ignored. The calculated terminal penetration depths should be regarded as speculative since data does not exist for the
portion of the penetration near the terminal depth, where the contribution of R is significant (Fig. 6.2).
With this as a baseline, the concept of a transition velocity was introduced, and the least-squares fitting error analysis
described above was carried out to improve the fits to the velocity-time data. In this analysis, two different set of C and R
were calculated for the high-velocity and low-velocity regimes. The results, shown in Fig. 6.3, reveal that for both the highvelocity and the low-velocity ranges, the error, as quantified by Chi squared values, remains relatively small, indicating a
good fit, until certain upper and lower velocity limits are surpassed. Past these velocities limit the value of Chi squared begins
to rapidly increase, indicating a poor fit. The velocity range where the errors for both fits transition from low to high values
was identified as the transition velocity range. Using this approach, an approximate velocity transition range of 60–80 m/s
was identified for densely packed sand, and a transition velocity of 100–120 m/s was identified for loosely packed sand. It
can be seen in Fig. 6.3 that the transition range can be more clearly and objectively identified in densely packed sand compared to loosely packed sand.
Fitting the data using two separate curves about a transition velocity, v t , improved the correlation between the best fits and
the data for tests performed in both loose and dense sand. The error values, as quantified by Chi squared, were at least an
(a)
(b)
Fig. 6.1 Data for experiments in loose sand (a) and dense sand (b) using a single drag coefficient, and assuming R = 0
Table 6.2 Results of fitting data using C ≠ 0 and R = 0
Test designation
C
Chi
2
Dense Dry OS (1420)
1.05
1.20e-2
Dense Dry OS (1426)
1.15
1.99e-2
Loose Dry OS (1427)
0.78
8.64e-3
Loose Dry OS (1428)
0.75
7.36e-3
6 Observations of Velocity-Dependent Drag and Bearing Stress in Sand Penetration
6.3 Results
Previous analysis of these data used constant values for the Poncelet coefficients [10, 11]. For example, Fig. 6.1 shows the
results of best fits to tests on dry Ottawa sand under loose and dense packing conditions using the Poncelet equations. In these
analyses, the contribution of the velocity- independent term was ignored, i.e., it was assumed that R = 0. It can be seen that a
fit using a single C value produces matches to data at high and low velocities, but the fit is less satisfactory at intermediate
velocities. This is especially true for dense sand. The results for goodness-of-fit are presented in Table 6.2.
Fitting the data using Eq. (6.2) and a single set of C and R values produced marginally improved results, as can be seen
in Table 6.3. In this case, R was taken as the average quasi- static penetration resistance from [7]. The best fit values for C
were also close to the values produced when ignoring R. Additionally, the Chi squared values were comparable to when R
was ignored. The calculated terminal penetration depths should be regarded as speculative since data does not exist for the
portion of the penetration near the terminal depth, where the contribution of R is significant (Fig. 6.2).
With this as a baseline, the concept of a transition velocity was introduced, and the least-squares fitting error analysis
described above was carried out to improve the fits to the velocity-time data. In this analysis, two different set of C and R
were calculated for the high-velocity and low-velocity regimes. The results, shown in Fig. 6.3, reveal that for both the highvelocity and the low-velocity ranges, the error, as quantified by Chi squared values, remains relatively small, indicating a
good fit, until certain upper and lower velocity limits are surpassed. Past these velocities limit the value of Chi squared begins
to rapidly increase, indicating a poor fit. The velocity range where the errors for both fits transition from low to high values
was identified as the transition velocity range. Using this approach, an approximate velocity transition range of 60–80 m/s
was identified for densely packed sand, and a transition velocity of 100–120 m/s was identified for loosely packed sand. It
can be seen in Fig. 6.3 that the transition range can be more clearly and objectively identified in densely packed sand compared to loosely packed sand.
Fitting the data using two separate curves about a transition velocity, v t , improved the correlation between the best fits and
the data for tests performed in both loose and dense sand. The error values, as quantified by Chi squared, were at least an
(a)
(b)
Fig. 6.1 Data for experiments in loose sand (a) and dense sand (b) using a single drag coefficient, and assuming R = 0
Table 6.2 Results of fitting data using C ≠ 0 and R = 0
Test designation
C
Chi
2
Dense Dry OS (1420)
1.05
1.20e-2
Dense Dry OS (1426)
1.15
1.99e-2
Loose Dry OS (1427)
0.78
8.64e-3
Loose Dry OS (1428)
0.75
7.36e-3
6 Observations of Velocity-Dependent Drag and Bearing Stress in Sand Penetration