

6.3 Geometrically Nonlinear Analysis of Smart Structures
115
(a)
0
0.05
0.1
0.15
0
0.1
0.2
0.3
0.4
0.5
0.6
0.7
0.8
Time (s)
Displacement (m)
LRT56 (SH851URI, mesh 10X1)
LRT56 (SH851URI, mesh 5X1)
LRT56 (SH851FI, mesh 10X1)
LRT56 (SH851FI, mesh 5X1)
Nonlinear (Yi,2000)
Linear (SH851URI, mesh 10X1)
Linear (Yi, 2000)
(b)
0
0.05
0.1
0.15
0
500
1000
1500
2000
2500
Time (s)
Voltage (V)
LRT56 (SH851URI, mesh 10X1)
LRT56 (SH851URI, mesh 5X1)
LRT56 (SH851FI, mesh 10X1)
LRT56 (SH851FI, mesh 5X1)
Nonlinear (Yi, 2000)
Linear (SH851URI, mesh 10X1)
Linear (Yi, 2000)
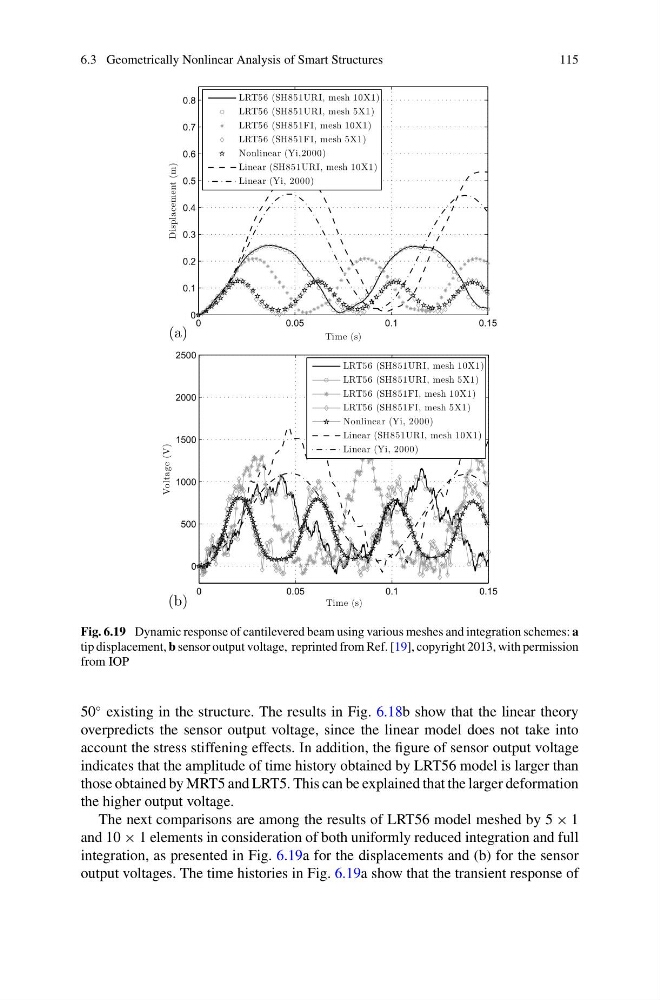
Fig. 6.19 Dynamic response of cantilevered beam using various meshes and integration schemes: a
tip displacement, b sensor output voltage, reprinted from Ref. [19], copyright 2013, with permission
from IOP
50
◦ existing in the structure. The results in Fig. 6.18b show that the linear theory
overpredicts the sensor output voltage, since the linear model does not take into
account the stress stiffening effects. In addition, the figure of sensor output voltage
indicates that the amplitude of time history obtained by LRT56 model is larger than
those obtained by MRT5 and LRT5. This can be explained that the larger deformation
the higher output voltage.
The next comparisons are among the results of LRT56 model meshed by 5 × 1
and 10 × 1 elements in consideration of both uniformly reduced integration and full
integration, as presented in Fig. 6.19a for the displacements and (b) for the sensor
output voltages. The time histories in Fig. 6.19a show that the transient response of
115
(a)
0
0.05
0.1
0.15
0
0.1
0.2
0.3
0.4
0.5
0.6
0.7
0.8
Time (s)
Displacement (m)
LRT56 (SH851URI, mesh 10X1)
LRT56 (SH851URI, mesh 5X1)
LRT56 (SH851FI, mesh 10X1)
LRT56 (SH851FI, mesh 5X1)
Nonlinear (Yi,2000)
Linear (SH851URI, mesh 10X1)
Linear (Yi, 2000)
(b)
0
0.05
0.1
0.15
0
500
1000
1500
2000
2500
Time (s)
Voltage (V)
LRT56 (SH851URI, mesh 10X1)
LRT56 (SH851URI, mesh 5X1)
LRT56 (SH851FI, mesh 10X1)
LRT56 (SH851FI, mesh 5X1)
Nonlinear (Yi, 2000)
Linear (SH851URI, mesh 10X1)
Linear (Yi, 2000)
Fig. 6.19 Dynamic response of cantilevered beam using various meshes and integration schemes: a
tip displacement, b sensor output voltage, reprinted from Ref. [19], copyright 2013, with permission
from IOP
50
◦ existing in the structure. The results in Fig. 6.18b show that the linear theory
overpredicts the sensor output voltage, since the linear model does not take into
account the stress stiffening effects. In addition, the figure of sensor output voltage
indicates that the amplitude of time history obtained by LRT56 model is larger than
those obtained by MRT5 and LRT5. This can be explained that the larger deformation
the higher output voltage.
The next comparisons are among the results of LRT56 model meshed by 5 × 1
and 10 × 1 elements in consideration of both uniformly reduced integration and full
integration, as presented in Fig. 6.19a for the displacements and (b) for the sensor
output voltages. The time histories in Fig. 6.19a show that the transient response of