

6.3 Geometrically Nonlinear Analysis of Smart Structures
113
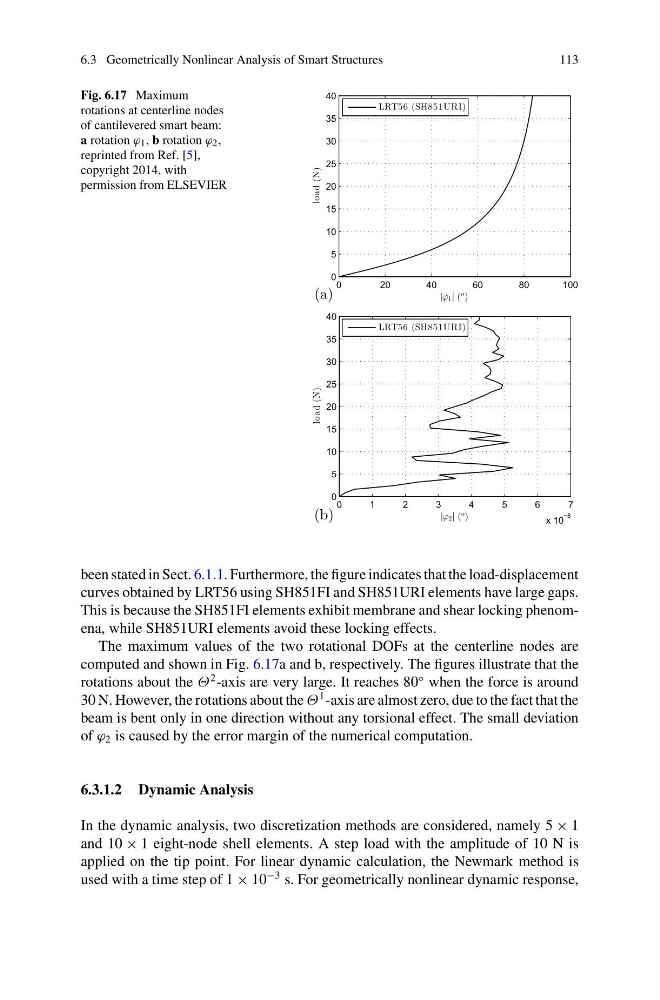
Fig. 6.17 Maximum
rotations at centerline nodes
of cantilevered smart beam:
a rotation ϕ 1 , b rotation ϕ 2 ,
reprinted from Ref. [5],
copyright 2014, with
permission from ELSEVIER
(a)
0
20
40
60
80
100
0
5
10
15
20
25
30
35
40
| 1| (
o )
load (N)
LRT56 (SH851URI)
(b)
0
1
2
3
4
5
6
7
x 10
−8
0
5
10
15
20
25
30
35
40
| 2| (
o )
load (N)
LRT56 (SH851URI)
been stated in Sect. 6.1.1. Furthermore, the figure indicates that the load-displacement
curves obtained by LRT56 using SH851FI and SH851URI elements have large gaps.
This is because the SH851FI elements exhibit membrane and shear locking phenomena, while SH851URI elements avoid these locking effects.
The maximum values of the two rotational DOFs at the centerline nodes are
computed and shown in Fig. 6.17a and b, respectively. The figures illustrate that the
rotations about the Θ
2 -axis are very large. It reaches 80
◦ when the force is around
30 N. However, the rotations about the Θ
1 -axis are almost zero, due to the fact that the
beam is bent only in one direction without any torsional effect. The small deviation
of ϕ 2 is caused by the error margin of the numerical computation.
6.3.1.2 Dynamic Analysis
In the dynamic analysis, two discretization methods are considered, namely 5 × 1
and 10 × 1 eight-node shell elements. A step load with the amplitude of 10 N is
applied on the tip point. For linear dynamic calculation, the Newmark method is
used with a time step of 1 × 10
−3 s. For geometrically nonlinear dynamic response,
113
Fig. 6.17 Maximum
rotations at centerline nodes
of cantilevered smart beam:
a rotation ϕ 1 , b rotation ϕ 2 ,
reprinted from Ref. [5],
copyright 2014, with
permission from ELSEVIER
(a)
0
20
40
60
80
100
0
5
10
15
20
25
30
35
40
| 1| (
o )
load (N)
LRT56 (SH851URI)
(b)
0
1
2
3
4
5
6
7
x 10
−8
0
5
10
15
20
25
30
35
40
| 2| (
o )
load (N)
LRT56 (SH851URI)
been stated in Sect. 6.1.1. Furthermore, the figure indicates that the load-displacement
curves obtained by LRT56 using SH851FI and SH851URI elements have large gaps.
This is because the SH851FI elements exhibit membrane and shear locking phenomena, while SH851URI elements avoid these locking effects.
The maximum values of the two rotational DOFs at the centerline nodes are
computed and shown in Fig. 6.17a and b, respectively. The figures illustrate that the
rotations about the Θ
2 -axis are very large. It reaches 80
◦ when the force is around
30 N. However, the rotations about the Θ
1 -axis are almost zero, due to the fact that the
beam is bent only in one direction without any torsional effect. The small deviation
of ϕ 2 is caused by the error margin of the numerical computation.
6.3.1.2 Dynamic Analysis
In the dynamic analysis, two discretization methods are considered, namely 5 × 1
and 10 × 1 eight-node shell elements. A step load with the amplitude of 10 N is
applied on the tip point. For linear dynamic calculation, the Newmark method is
used with a time step of 1 × 10
−3 s. For geometrically nonlinear dynamic response,