

4.1 Sandwich core
57
-0.2
-0.15
-0.1
-0.05
0
0.05
Strain [-]
-3
-2
-1
0
1
2
3
Stress [MPa]
Tension/Compression T
Test scatter
Test average
ML Resin Coating
ML Resin Corner iRegC
ML Resin Corner iReg
0
0.05
0.1
0.15
0.2
Strain [-]
0
0.5
1
1.5
Stress [MPa]
Shear LT
0
0.05
0.1
0.15
0.2
Strain [-]
0
0.2
0.4
0.6
0.8
1
Stress [MPa]
Shear WT
Underestimated
plateau strength
2nd peak
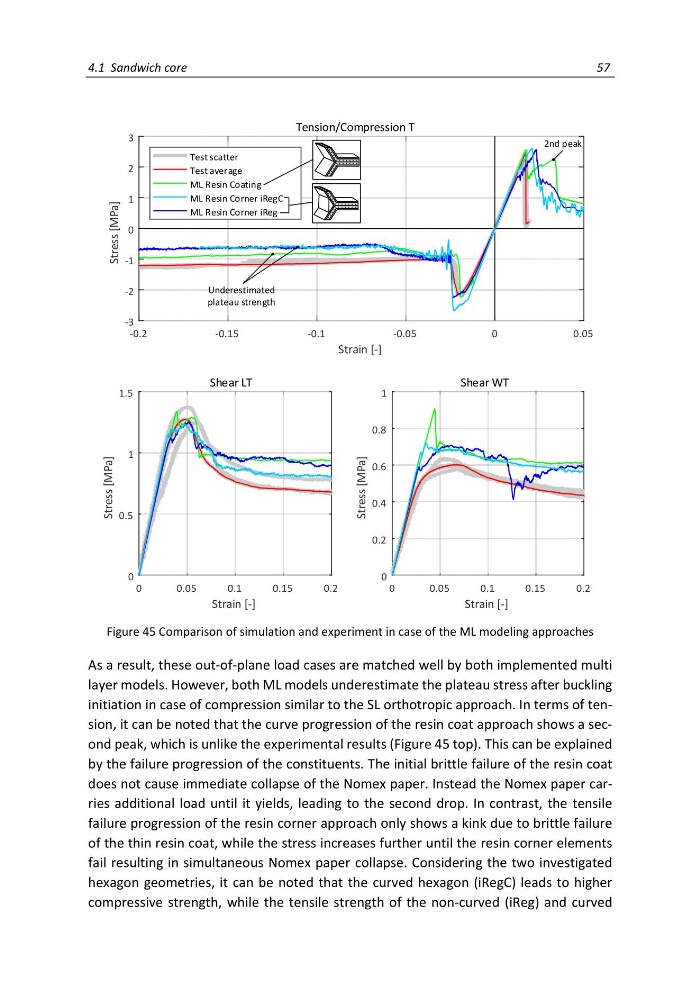
Figure 45 Comparison of simulation and experiment in case of the ML modeling approaches
As a result, these out-of-plane load cases are matched well by both implemented multi
layer models. However, both ML models underestimate the plateau stress after buckling
initiation in case of compression similar to the SL orthotropic approach. In terms of tension, it can be noted that the curve progression of the resin coat approach shows a second peak, which is unlike the experimental results (Figure 45 top). This can be explained
by the failure progression of the constituents. The initial brittle failure of the resin coat
does not cause immediate collapse of the Nomex paper. Instead the Nomex paper carries additional load until it yields, leading to the second drop. In contrast, the tensile
failure progression of the resin corner approach only shows a kink due to brittle failure
of the thin resin coat, while the stress increases further until the resin corner elements
fail resulting in simultaneous Nomex paper collapse. Considering the two investigated
hexagon geometries, it can be noted that the curved hexagon (iRegC) leads to higher
compressive strength, while the tensile strength of the non-curved (iReg) and curved
57
-0.2
-0.15
-0.1
-0.05
0
0.05
Strain [-]
-3
-2
-1
0
1
2
3
Stress [MPa]
Tension/Compression T
Test scatter
Test average
ML Resin Coating
ML Resin Corner iRegC
ML Resin Corner iReg
0
0.05
0.1
0.15
0.2
Strain [-]
0
0.5
1
1.5
Stress [MPa]
Shear LT
0
0.05
0.1
0.15
0.2
Strain [-]
0
0.2
0.4
0.6
0.8
1
Stress [MPa]
Shear WT
Underestimated
plateau strength
2nd peak
Figure 45 Comparison of simulation and experiment in case of the ML modeling approaches
As a result, these out-of-plane load cases are matched well by both implemented multi
layer models. However, both ML models underestimate the plateau stress after buckling
initiation in case of compression similar to the SL orthotropic approach. In terms of tension, it can be noted that the curve progression of the resin coat approach shows a second peak, which is unlike the experimental results (Figure 45 top). This can be explained
by the failure progression of the constituents. The initial brittle failure of the resin coat
does not cause immediate collapse of the Nomex paper. Instead the Nomex paper carries additional load until it yields, leading to the second drop. In contrast, the tensile
failure progression of the resin corner approach only shows a kink due to brittle failure
of the thin resin coat, while the stress increases further until the resin corner elements
fail resulting in simultaneous Nomex paper collapse. Considering the two investigated
hexagon geometries, it can be noted that the curved hexagon (iRegC) leads to higher
compressive strength, while the tensile strength of the non-curved (iReg) and curved