

6.11 Case Study: Functional Adaptation in Arteries
329
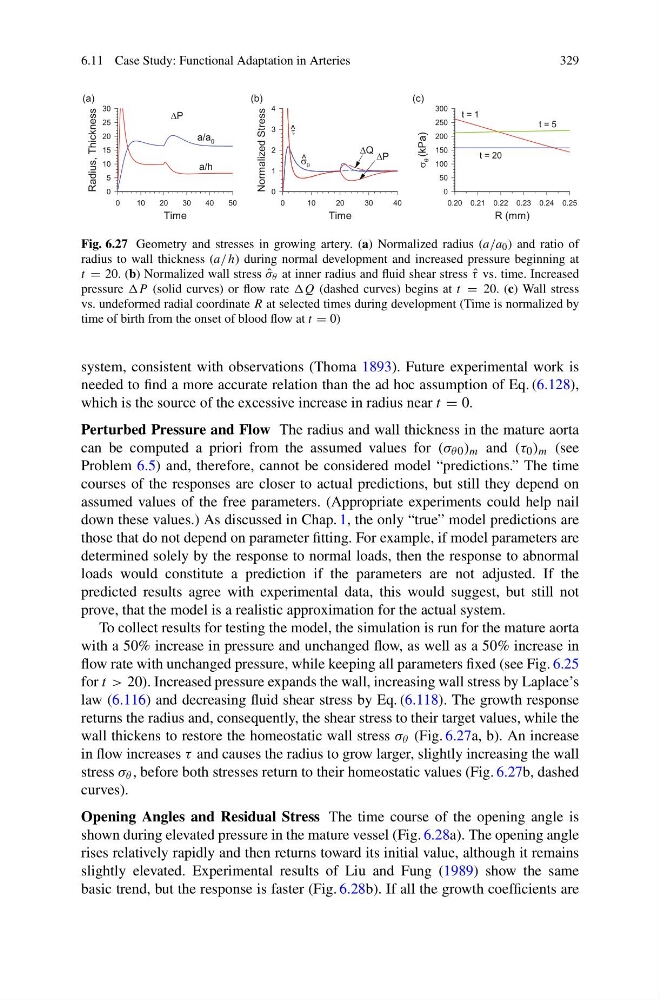
Fig. 6.27 Geometry and stresses in growing artery. (a) Normalized radius (a/a 0 ) and ratio of
radius to wall thickness (a/ h) during normal development and increased pressure beginning at
t = 20. (b) Normalized wall stress ˆ
σ θ at inner radius and fluid shear stress ˆ
τ vs. time. Increased
pressure P (solid curves) or flow rate Q (dashed curves) begins at t = 20. (c) Wall stress
vs. undeformed radial coordinate R at selected times during development (Time is normalized by
time of birth from the onset of blood flow at t = 0)
system, consistent with observations (Thoma 1893). Future experimental work is
needed to find a more accurate relation than the ad hoc assumption of Eq. (6.128),
which is the source of the excessive increase in radius near t = 0.
Perturbed Pressure and Flow The radius and wall thickness in the mature aorta
can be computed a priori from the assumed values for (σ θ0 ) m and (τ 0 ) m (see
Problem 6.5) and, therefore, cannot be considered model “predictions.” The time
courses of the responses are closer to actual predictions, but still they depend on
assumed values of the free parameters. (Appropriate experiments could help nail
down these values.) As discussed in Chap. 1, the only “true” model predictions are
those that do not depend on parameter fitting. For example, if model parameters are
determined solely by the response to normal loads, then the response to abnormal
loads would constitute a prediction if the parameters are not adjusted. If the
predicted results agree with experimental data, this would suggest, but still not
prove, that the model is a realistic approximation for the actual system.
To collect results for testing the model, the simulation is run for the mature aorta
with a 50% increase in pressure and unchanged flow, as well as a 50% increase in
flow rate with unchanged pressure, while keeping all parameters fixed (see Fig. 6.25
for t > 20). Increased pressure expands the wall, increasing wall stress by Laplace’s
law (6.116) and decreasing fluid shear stress by Eq. (6.118). The growth response
returns the radius and, consequently, the shear stress to their target values, while the
wall thickens to restore the homeostatic wall stress σ θ (Fig. 6.27a, b). An increase
in flow increases τ and causes the radius to grow larger, slightly increasing the wall
stress σ θ , before both stresses return to their homeostatic values (Fig. 6.27b, dashed
curves).
Opening Angles and Residual Stress The time course of the opening angle is
shown during elevated pressure in the mature vessel (Fig. 6.28a). The opening angle
rises relatively rapidly and then returns toward its initial value, although it remains
slightly elevated. Experimental results of Liu and Fung (1989) show the same
basic trend, but the response is faster (Fig. 6.28b). If all the growth coefficients are
329
Fig. 6.27 Geometry and stresses in growing artery. (a) Normalized radius (a/a 0 ) and ratio of
radius to wall thickness (a/ h) during normal development and increased pressure beginning at
t = 20. (b) Normalized wall stress ˆ
σ θ at inner radius and fluid shear stress ˆ
τ vs. time. Increased
pressure P (solid curves) or flow rate Q (dashed curves) begins at t = 20. (c) Wall stress
vs. undeformed radial coordinate R at selected times during development (Time is normalized by
time of birth from the onset of blood flow at t = 0)
system, consistent with observations (Thoma 1893). Future experimental work is
needed to find a more accurate relation than the ad hoc assumption of Eq. (6.128),
which is the source of the excessive increase in radius near t = 0.
Perturbed Pressure and Flow The radius and wall thickness in the mature aorta
can be computed a priori from the assumed values for (σ θ0 ) m and (τ 0 ) m (see
Problem 6.5) and, therefore, cannot be considered model “predictions.” The time
courses of the responses are closer to actual predictions, but still they depend on
assumed values of the free parameters. (Appropriate experiments could help nail
down these values.) As discussed in Chap. 1, the only “true” model predictions are
those that do not depend on parameter fitting. For example, if model parameters are
determined solely by the response to normal loads, then the response to abnormal
loads would constitute a prediction if the parameters are not adjusted. If the
predicted results agree with experimental data, this would suggest, but still not
prove, that the model is a realistic approximation for the actual system.
To collect results for testing the model, the simulation is run for the mature aorta
with a 50% increase in pressure and unchanged flow, as well as a 50% increase in
flow rate with unchanged pressure, while keeping all parameters fixed (see Fig. 6.25
for t > 20). Increased pressure expands the wall, increasing wall stress by Laplace’s
law (6.116) and decreasing fluid shear stress by Eq. (6.118). The growth response
returns the radius and, consequently, the shear stress to their target values, while the
wall thickens to restore the homeostatic wall stress σ θ (Fig. 6.27a, b). An increase
in flow increases τ and causes the radius to grow larger, slightly increasing the wall
stress σ θ , before both stresses return to their homeostatic values (Fig. 6.27b, dashed
curves).
Opening Angles and Residual Stress The time course of the opening angle is
shown during elevated pressure in the mature vessel (Fig. 6.28a). The opening angle
rises relatively rapidly and then returns toward its initial value, although it remains
slightly elevated. Experimental results of Liu and Fung (1989) show the same
basic trend, but the response is faster (Fig. 6.28b). If all the growth coefficients are