

6.11 Case Study: Functional Adaptation in Arteries
319
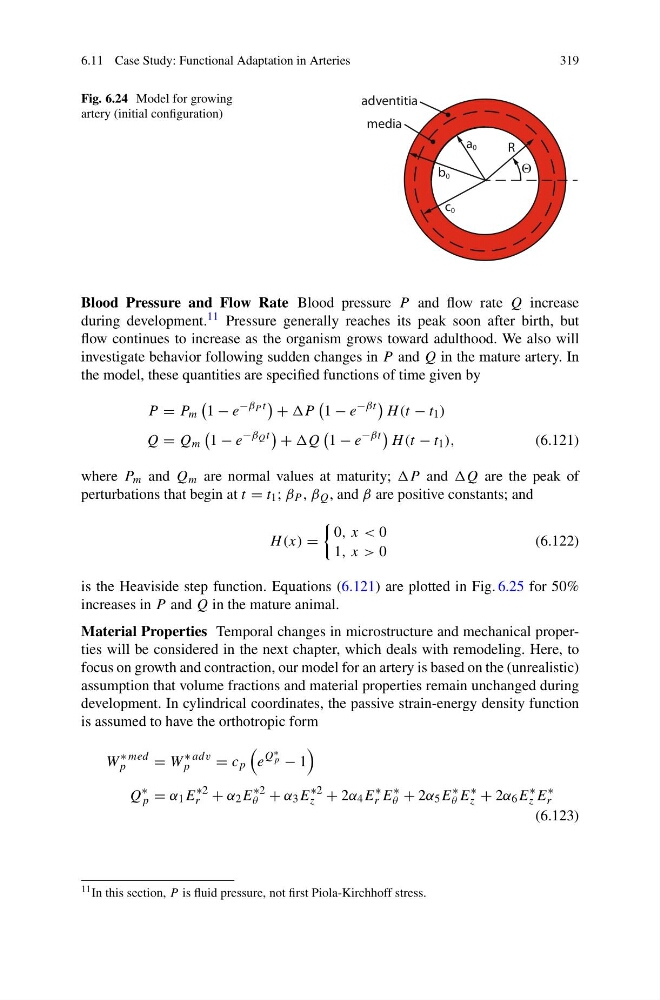
Fig. 6.24 Model for growing
artery (initial configuration)
R
Θ
a 0
c 0
b 0
adventitia
media
Blood Pressure and Flow Rate Blood pressure P and flow rate Q increase
during development. 11 Pressure generally reaches its peak soon after birth, but
flow continues to increase as the organism grows toward adulthood. We also will
investigate behavior following sudden changes in P and Q in the mature artery. In
the model, these quantities are specified functions of time given by
P = P m
1 − e
−β P t
+ P
1 − e
−βt
H (t − t 1 )
Q = Q m
1 − e
−β Q t
+ Q
1 − e
−βt
H (t − t 1 ),
(6.121)
where P m and Q m are normal values at maturity; P and Q are the peak of
perturbations that begin at t = t 1 ; β P , β Q , and β are positive constants; and
H (x) =
0, x < 0
1, x > 0
(6.122)
is the Heaviside step function. Equations (6.121) are plotted in Fig. 6.25 for 50%
increases in P and Q in the mature animal.
Material Properties Temporal changes in microstructure and mechanical properties will be considered in the next chapter, which deals with remodeling. Here, to
focus on growth and contraction, our model for an artery is based on the (unrealistic)
assumption that volume fractions and material properties remain unchanged during
development. In cylindrical coordinates, the passive strain-energy density function
is assumed to have the orthotropic form
W
∗ med
p
= W
∗ adv
p
= c p
e
Q ∗
p − 1
Q
∗
p = α 1 E
∗2
r + α 2 E
∗2
θ + α 3 E
∗2
z + 2α 4 E
∗
r E
∗
θ + 2α 5 E
∗
θ E
∗
z + 2α 6 E
∗
z E
∗
r
(6.123)
11 In this section, P is fluid pressure, not first Piola-Kirchhoff stress.
319
Fig. 6.24 Model for growing
artery (initial configuration)
R
Θ
a 0
c 0
b 0
adventitia
media
Blood Pressure and Flow Rate Blood pressure P and flow rate Q increase
during development. 11 Pressure generally reaches its peak soon after birth, but
flow continues to increase as the organism grows toward adulthood. We also will
investigate behavior following sudden changes in P and Q in the mature artery. In
the model, these quantities are specified functions of time given by
P = P m
1 − e
−β P t
+ P
1 − e
−βt
H (t − t 1 )
Q = Q m
1 − e
−β Q t
+ Q
1 − e
−βt
H (t − t 1 ),
(6.121)
where P m and Q m are normal values at maturity; P and Q are the peak of
perturbations that begin at t = t 1 ; β P , β Q , and β are positive constants; and
H (x) =
0, x < 0
1, x > 0
(6.122)
is the Heaviside step function. Equations (6.121) are plotted in Fig. 6.25 for 50%
increases in P and Q in the mature animal.
Material Properties Temporal changes in microstructure and mechanical properties will be considered in the next chapter, which deals with remodeling. Here, to
focus on growth and contraction, our model for an artery is based on the (unrealistic)
assumption that volume fractions and material properties remain unchanged during
development. In cylindrical coordinates, the passive strain-energy density function
is assumed to have the orthotropic form
W
∗ med
p
= W
∗ adv
p
= c p
e
Q ∗
p − 1
Q
∗
p = α 1 E
∗2
r + α 2 E
∗2
θ + α 3 E
∗2
z + 2α 4 E
∗
r E
∗
θ + 2α 5 E
∗
θ E
∗
z + 2α 6 E
∗
z E
∗
r
(6.123)
11 In this section, P is fluid pressure, not first Piola-Kirchhoff stress.