

6.5 Residual Stress
271
λ
3
=
1
−1 G 2 ( ¯
Y ) d ¯
Y
1
−1 G −1 ( ¯
Y ) d ¯
Y
.
(6.35)
With G given by Eq. (6.33), the numerator can be integrated relatively easily.
Fortunately, with the help of a table of integrals or Mathematica, the denominator
also can be integrated in closed form to obtain
λ =
⎡
⎢
⎢
⎣
1 +
4
3 a +
8
15 a 2
√
a(1 + a)
tanh
−1
a
1 + a
⎤
⎥
⎥
⎦
1
3
.
(6.36)
Results
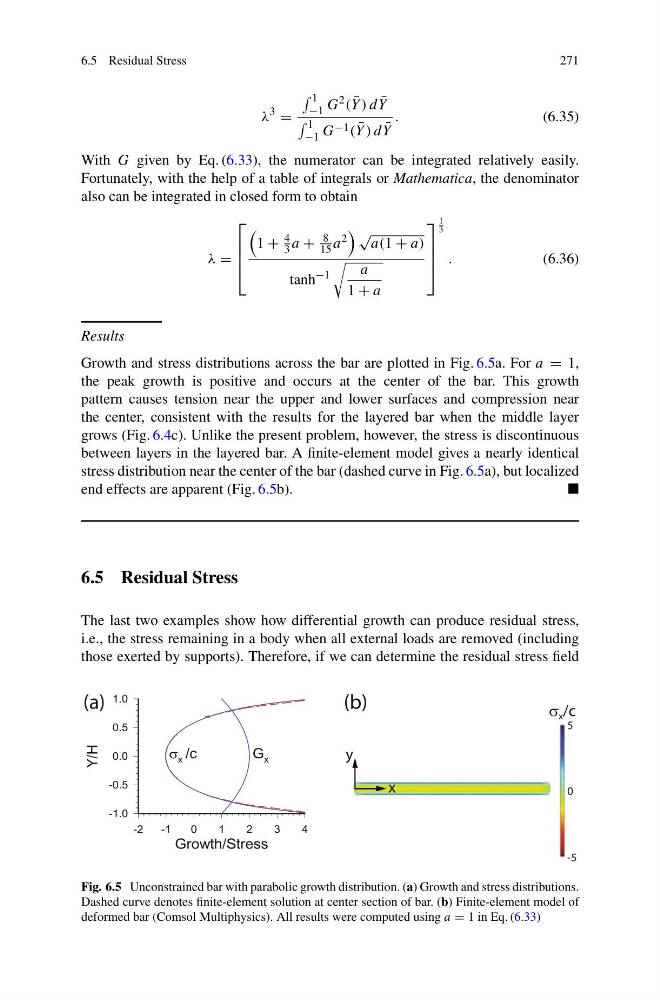
Growth and stress distributions across the bar are plotted in Fig. 6.5a. For a = 1,
the peak growth is positive and occurs at the center of the bar. This growth
pattern causes tension near the upper and lower surfaces and compression near
the center, consistent with the results for the layered bar when the middle layer
grows (Fig. 6.4c). Unlike the present problem, however, the stress is discontinuous
between layers in the layered bar. A finite-element model gives a nearly identical
stress distribution near the center of the bar (dashed curve in Fig. 6.5a), but localized
end effects are apparent (Fig. 6.5b).
6.5 Residual Stress
The last two examples show how differential growth can produce residual stress,
i.e., the stress remaining in a body when all external loads are removed (including
those exerted by supports). Therefore, if we can determine the residual stress field
(b)
(a)
σ x /c
5
-5
0
x
y
Fig. 6.5 Unconstrained bar with parabolic growth distribution. (a) Growth and stress distributions.
Dashed curve denotes finite-element solution at center section of bar. (b) Finite-element model of
deformed bar (Comsol Multiphysics). All results were computed using a = 1 in Eq. (6.33)
271
λ
3
=
1
−1 G 2 ( ¯
Y ) d ¯
Y
1
−1 G −1 ( ¯
Y ) d ¯
Y
.
(6.35)
With G given by Eq. (6.33), the numerator can be integrated relatively easily.
Fortunately, with the help of a table of integrals or Mathematica, the denominator
also can be integrated in closed form to obtain
λ =
⎡
⎢
⎢
⎣
1 +
4
3 a +
8
15 a 2
√
a(1 + a)
tanh
−1
a
1 + a
⎤
⎥
⎥
⎦
1
3
.
(6.36)
Results
Growth and stress distributions across the bar are plotted in Fig. 6.5a. For a = 1,
the peak growth is positive and occurs at the center of the bar. This growth
pattern causes tension near the upper and lower surfaces and compression near
the center, consistent with the results for the layered bar when the middle layer
grows (Fig. 6.4c). Unlike the present problem, however, the stress is discontinuous
between layers in the layered bar. A finite-element model gives a nearly identical
stress distribution near the center of the bar (dashed curve in Fig. 6.5a), but localized
end effects are apparent (Fig. 6.5b).
6.5 Residual Stress
The last two examples show how differential growth can produce residual stress,
i.e., the stress remaining in a body when all external loads are removed (including
those exerted by supports). Therefore, if we can determine the residual stress field
(b)
(a)
σ x /c
5
-5
0
x
y
Fig. 6.5 Unconstrained bar with parabolic growth distribution. (a) Growth and stress distributions.
Dashed curve denotes finite-element solution at center section of bar. (b) Finite-element model of
deformed bar (Comsol Multiphysics). All results were computed using a = 1 in Eq. (6.33)