

5.5 Case Study: Cardiac Mechanics
237
Pressure
Volume
EDPVR
ESPVR
(a)
(b)
Pressure
Volume
EDPVR
ESPVR
A 3
A 1
A 2
stroke work
passive energy
active
energy
.
A
D
B
C
active energy
passive energy
.
.
.
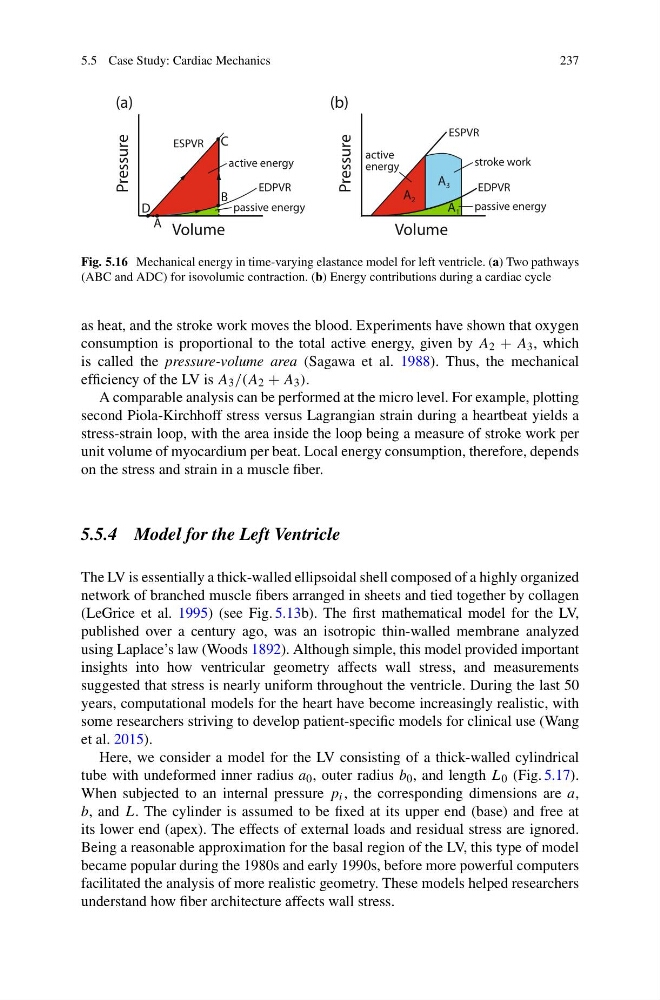
Fig. 5.16 Mechanical energy in time-varying elastance model for left ventricle. (a) Two pathways
(ABC and ADC) for isovolumic contraction. (b) Energy contributions during a cardiac cycle
as heat, and the stroke work moves the blood. Experiments have shown that oxygen
consumption is proportional to the total active energy, given by A 2 + A 3 , which
is called the pressure-volume area (Sagawa et al. 1988). Thus, the mechanical
efficiency of the LV is A 3 /(A 2 + A 3 ).
A comparable analysis can be performed at the micro level. For example, plotting
second Piola-Kirchhoff stress versus Lagrangian strain during a heartbeat yields a
stress-strain loop, with the area inside the loop being a measure of stroke work per
unit volume of myocardium per beat. Local energy consumption, therefore, depends
on the stress and strain in a muscle fiber.
5.5.4 Model for the Left Ventricle
The LV is essentially a thick-walled ellipsoidal shell composed of a highly organized
network of branched muscle fibers arranged in sheets and tied together by collagen
(LeGrice et al. 1995) (see Fig. 5.13b). The first mathematical model for the LV,
published over a century ago, was an isotropic thin-walled membrane analyzed
using Laplace’s law (Woods 1892). Although simple, this model provided important
insights into how ventricular geometry affects wall stress, and measurements
suggested that stress is nearly uniform throughout the ventricle. During the last 50
years, computational models for the heart have become increasingly realistic, with
some researchers striving to develop patient-specific models for clinical use (Wang
et al. 2015).
Here, we consider a model for the LV consisting of a thick-walled cylindrical
tube with undeformed inner radius a 0 , outer radius b 0 , and length L 0 (Fig. 5.17).
When subjected to an internal pressure p i , the corresponding dimensions are a,
b, and L. The cylinder is assumed to be fixed at its upper end (base) and free at
its lower end (apex). The effects of external loads and residual stress are ignored.
Being a reasonable approximation for the basal region of the LV, this type of model
became popular during the 1980s and early 1990s, before more powerful computers
facilitated the analysis of more realistic geometry. These models helped researchers
understand how fiber architecture affects wall stress.
237
Pressure
Volume
EDPVR
ESPVR
(a)
(b)
Pressure
Volume
EDPVR
ESPVR
A 3
A 1
A 2
stroke work
passive energy
active
energy
.
A
D
B
C
active energy
passive energy
.
.
.
Fig. 5.16 Mechanical energy in time-varying elastance model for left ventricle. (a) Two pathways
(ABC and ADC) for isovolumic contraction. (b) Energy contributions during a cardiac cycle
as heat, and the stroke work moves the blood. Experiments have shown that oxygen
consumption is proportional to the total active energy, given by A 2 + A 3 , which
is called the pressure-volume area (Sagawa et al. 1988). Thus, the mechanical
efficiency of the LV is A 3 /(A 2 + A 3 ).
A comparable analysis can be performed at the micro level. For example, plotting
second Piola-Kirchhoff stress versus Lagrangian strain during a heartbeat yields a
stress-strain loop, with the area inside the loop being a measure of stroke work per
unit volume of myocardium per beat. Local energy consumption, therefore, depends
on the stress and strain in a muscle fiber.
5.5.4 Model for the Left Ventricle
The LV is essentially a thick-walled ellipsoidal shell composed of a highly organized
network of branched muscle fibers arranged in sheets and tied together by collagen
(LeGrice et al. 1995) (see Fig. 5.13b). The first mathematical model for the LV,
published over a century ago, was an isotropic thin-walled membrane analyzed
using Laplace’s law (Woods 1892). Although simple, this model provided important
insights into how ventricular geometry affects wall stress, and measurements
suggested that stress is nearly uniform throughout the ventricle. During the last 50
years, computational models for the heart have become increasingly realistic, with
some researchers striving to develop patient-specific models for clinical use (Wang
et al. 2015).
Here, we consider a model for the LV consisting of a thick-walled cylindrical
tube with undeformed inner radius a 0 , outer radius b 0 , and length L 0 (Fig. 5.17).
When subjected to an internal pressure p i , the corresponding dimensions are a,
b, and L. The cylinder is assumed to be fixed at its upper end (base) and free at
its lower end (apex). The effects of external loads and residual stress are ignored.
Being a reasonable approximation for the basal region of the LV, this type of model
became popular during the 1980s and early 1990s, before more powerful computers
facilitated the analysis of more realistic geometry. These models helped researchers
understand how fiber architecture affects wall stress.