

5.5 Case Study: Cardiac Mechanics
233
Superior
Vena Cava
Aorta
Right
Atrium
Left
Atrium
Pulmonary
Valve
Tricuspid
Valve
Right
Ventricle
Left
Ventricle
Inferior Vena Cava
Aortic
Valve
Mitral
Valve
Pulmonary
Vein
Pulmonary
Artery
Sheet
Collagen
muscle fibre
b
a
LV
(a)
(b)
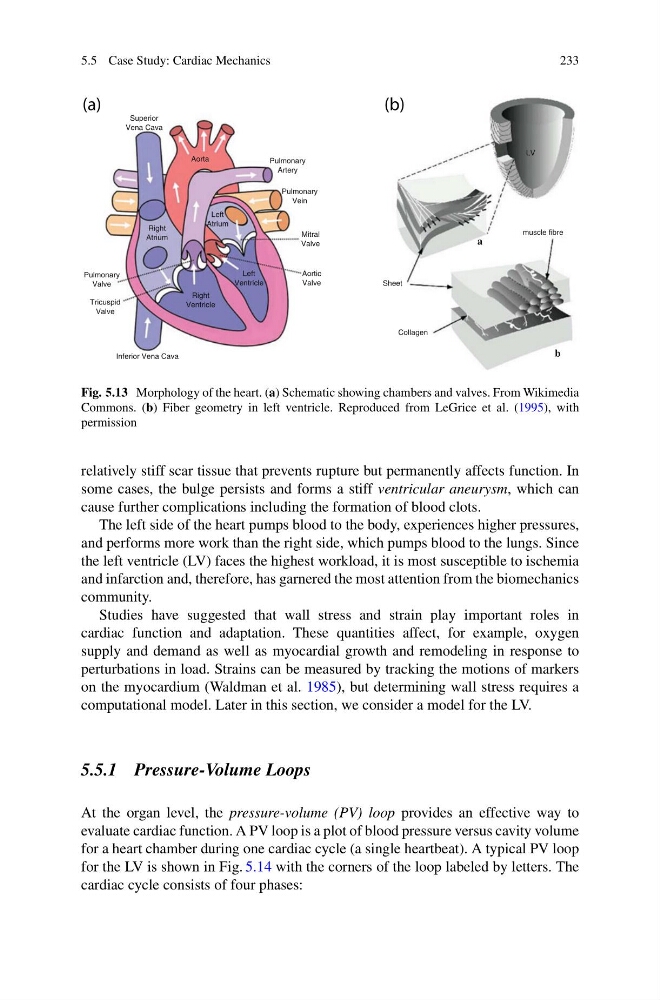
Fig. 5.13 Morphology of the heart. (a) Schematic showing chambers and valves. From Wikimedia
Commons. (b) Fiber geometry in left ventricle. Reproduced from LeGrice et al. (1995), with
permission
relatively stiff scar tissue that prevents rupture but permanently affects function. In
some cases, the bulge persists and forms a stiff ventricular aneurysm, which can
cause further complications including the formation of blood clots.
The left side of the heart pumps blood to the body, experiences higher pressures,
and performs more work than the right side, which pumps blood to the lungs. Since
the left ventricle (LV) faces the highest workload, it is most susceptible to ischemia
and infarction and, therefore, has garnered the most attention from the biomechanics
community.
Studies have suggested that wall stress and strain play important roles in
cardiac function and adaptation. These quantities affect, for example, oxygen
supply and demand as well as myocardial growth and remodeling in response to
perturbations in load. Strains can be measured by tracking the motions of markers
on the myocardium (Waldman et al. 1985), but determining wall stress requires a
computational model. Later in this section, we consider a model for the LV.
5.5.1 Pressure-Volume Loops
At the organ level, the pressure-volume (PV) loop provides an effective way to
evaluate cardiac function. A PV loop is a plot of blood pressure versus cavity volume
for a heart chamber during one cardiac cycle (a single heartbeat). A typical PV loop
for the LV is shown in Fig. 5.14 with the corners of the loop labeled by letters. The
cardiac cycle consists of four phases:
233
Superior
Vena Cava
Aorta
Right
Atrium
Left
Atrium
Pulmonary
Valve
Tricuspid
Valve
Right
Ventricle
Left
Ventricle
Inferior Vena Cava
Aortic
Valve
Mitral
Valve
Pulmonary
Vein
Pulmonary
Artery
Sheet
Collagen
muscle fibre
b
a
LV
(a)
(b)
Fig. 5.13 Morphology of the heart. (a) Schematic showing chambers and valves. From Wikimedia
Commons. (b) Fiber geometry in left ventricle. Reproduced from LeGrice et al. (1995), with
permission
relatively stiff scar tissue that prevents rupture but permanently affects function. In
some cases, the bulge persists and forms a stiff ventricular aneurysm, which can
cause further complications including the formation of blood clots.
The left side of the heart pumps blood to the body, experiences higher pressures,
and performs more work than the right side, which pumps blood to the lungs. Since
the left ventricle (LV) faces the highest workload, it is most susceptible to ischemia
and infarction and, therefore, has garnered the most attention from the biomechanics
community.
Studies have suggested that wall stress and strain play important roles in
cardiac function and adaptation. These quantities affect, for example, oxygen
supply and demand as well as myocardial growth and remodeling in response to
perturbations in load. Strains can be measured by tracking the motions of markers
on the myocardium (Waldman et al. 1985), but determining wall stress requires a
computational model. Later in this section, we consider a model for the LV.
5.5.1 Pressure-Volume Loops
At the organ level, the pressure-volume (PV) loop provides an effective way to
evaluate cardiac function. A PV loop is a plot of blood pressure versus cavity volume
for a heart chamber during one cardiac cycle (a single heartbeat). A typical PV loop
for the LV is shown in Fig. 5.14 with the corners of the loop labeled by letters. The
cardiac cycle consists of four phases: