

358
P. Liu
that the followability of the particle satisfies the requirement, the velocity of
the particle can represent the velocity of the fluid.
(4) Laser-induced fluorescence flow visualization and measurement technique
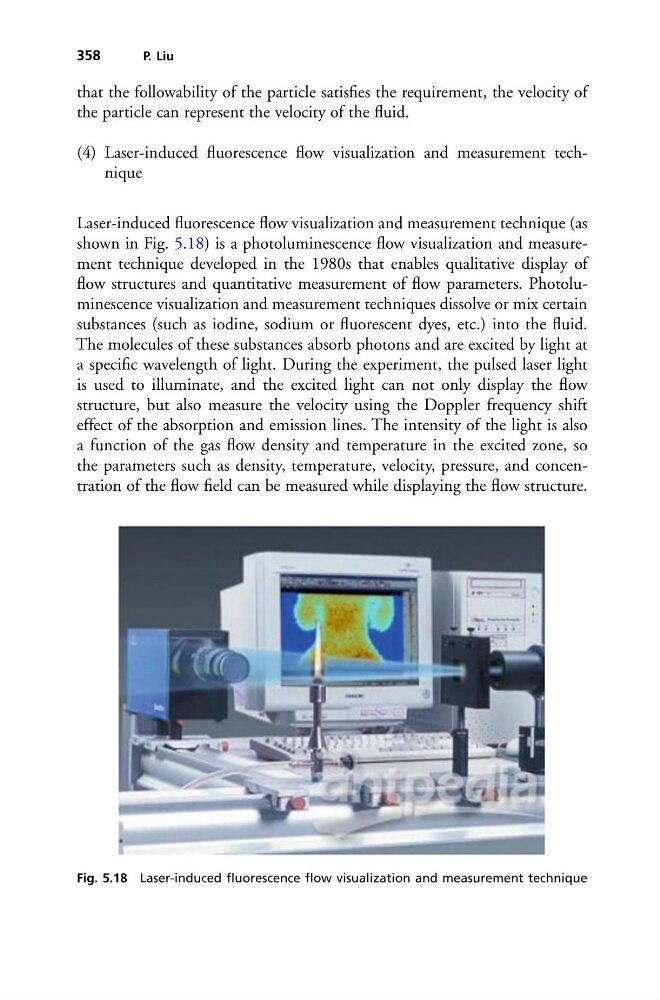
Laser-induced fluorescence flow visualization and measurement technique (as
shown in Fig. 5.18) is a photoluminescence flow visualization and measurement technique developed in the 1980s that enables qualitative display of
flow structures and quantitative measurement of flow parameters. Photoluminescence visualization and measurement techniques dissolve or mix certain
substances (such as iodine, sodium or fluorescent dyes, etc.) into the fluid.
The molecules of these substances absorb photons and are excited by light at
a specific wavelength of light. During the experiment, the pulsed laser light
is used to illuminate, and the excited light can not only display the flow
structure, but also measure the velocity using the Doppler frequency shift
effect of the absorption and emission lines. The intensity of the light is also
a function of the gas flow density and temperature in the excited zone, so
the parameters such as density, temperature, velocity, pressure, and concentration of the flow field can be measured while displaying the flow structure.
Fig. 5.18 Laser-induced fluorescence flow visualization and measurement technique
P. Liu
that the followability of the particle satisfies the requirement, the velocity of
the particle can represent the velocity of the fluid.
(4) Laser-induced fluorescence flow visualization and measurement technique
Laser-induced fluorescence flow visualization and measurement technique (as
shown in Fig. 5.18) is a photoluminescence flow visualization and measurement technique developed in the 1980s that enables qualitative display of
flow structures and quantitative measurement of flow parameters. Photoluminescence visualization and measurement techniques dissolve or mix certain
substances (such as iodine, sodium or fluorescent dyes, etc.) into the fluid.
The molecules of these substances absorb photons and are excited by light at
a specific wavelength of light. During the experiment, the pulsed laser light
is used to illuminate, and the excited light can not only display the flow
structure, but also measure the velocity using the Doppler frequency shift
effect of the absorption and emission lines. The intensity of the light is also
a function of the gas flow density and temperature in the excited zone, so
the parameters such as density, temperature, velocity, pressure, and concentration of the flow field can be measured while displaying the flow structure.
Fig. 5.18 Laser-induced fluorescence flow visualization and measurement technique