

4 Computational Fluid Dynamics
329
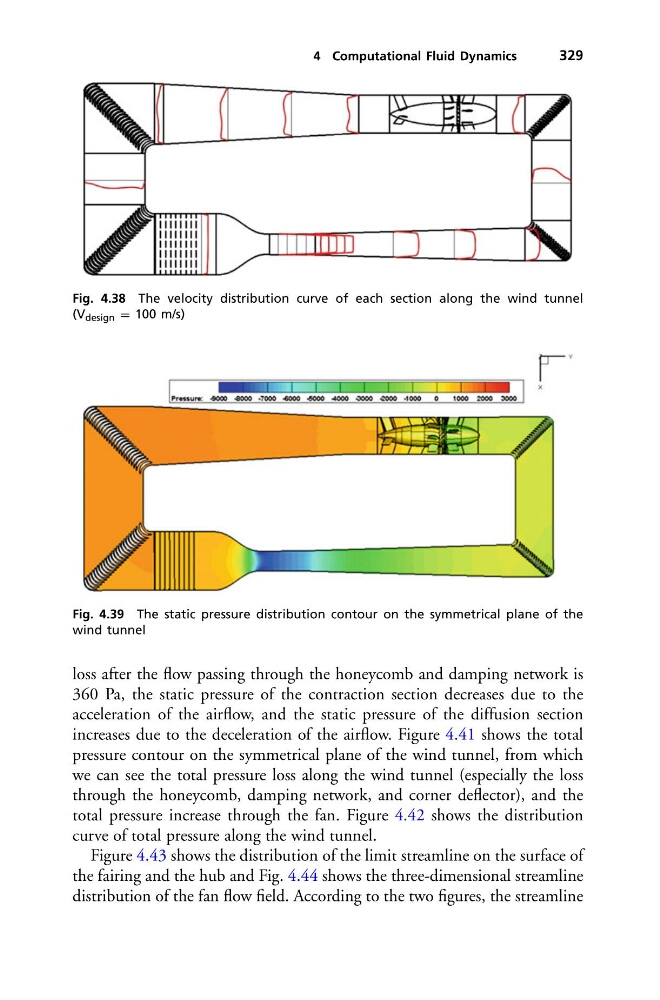
Fig. 4.38 The velocity distribution curve of each section along the wind tunnel
(V design = 100 m/s)
Fig. 4.39 The static pressure distribution contour on the symmetrical plane of the
wind tunnel
loss after the flow passing through the honeycomb and damping network is
360 Pa, the static pressure of the contraction section decreases due to the
acceleration of the airflow, and the static pressure of the diffusion section
increases due to the deceleration of the airflow. Figure 4.41 shows the total
pressure contour on the symmetrical plane of the wind tunnel, from which
we can see the total pressure loss along the wind tunnel (especially the loss
through the honeycomb, damping network, and corner deflector), and the
total pressure increase through the fan. Figure 4.42 shows the distribution
curve of total pressure along the wind tunnel.
Figure 4.43 shows the distribution of the limit streamline on the surface of
the fairing and the hub and Fig. 4.44 shows the three-dimensional streamline
distribution of the fan flow field. According to the two figures, the streamline
329
Fig. 4.38 The velocity distribution curve of each section along the wind tunnel
(V design = 100 m/s)
Fig. 4.39 The static pressure distribution contour on the symmetrical plane of the
wind tunnel
loss after the flow passing through the honeycomb and damping network is
360 Pa, the static pressure of the contraction section decreases due to the
acceleration of the airflow, and the static pressure of the diffusion section
increases due to the deceleration of the airflow. Figure 4.41 shows the total
pressure contour on the symmetrical plane of the wind tunnel, from which
we can see the total pressure loss along the wind tunnel (especially the loss
through the honeycomb, damping network, and corner deflector), and the
total pressure increase through the fan. Figure 4.42 shows the distribution
curve of total pressure along the wind tunnel.
Figure 4.43 shows the distribution of the limit streamline on the surface of
the fairing and the hub and Fig. 4.44 shows the three-dimensional streamline
distribution of the fan flow field. According to the two figures, the streamline