

ultraviolet light stimulation changed 1266-fold to 500 ppb nitrogen dioxide gas at
room temperature due to increasing photogenerated electrons (Lu et al. 2012). Tin
dioxide nanocomposites with a small amount of strontium oxide, calcium oxide,
barium oxide, bismuth oxide, and samarium oxide have been reported for the
sensing of nitrous oxide in the concentration range of 10–300 ppm at 500
C
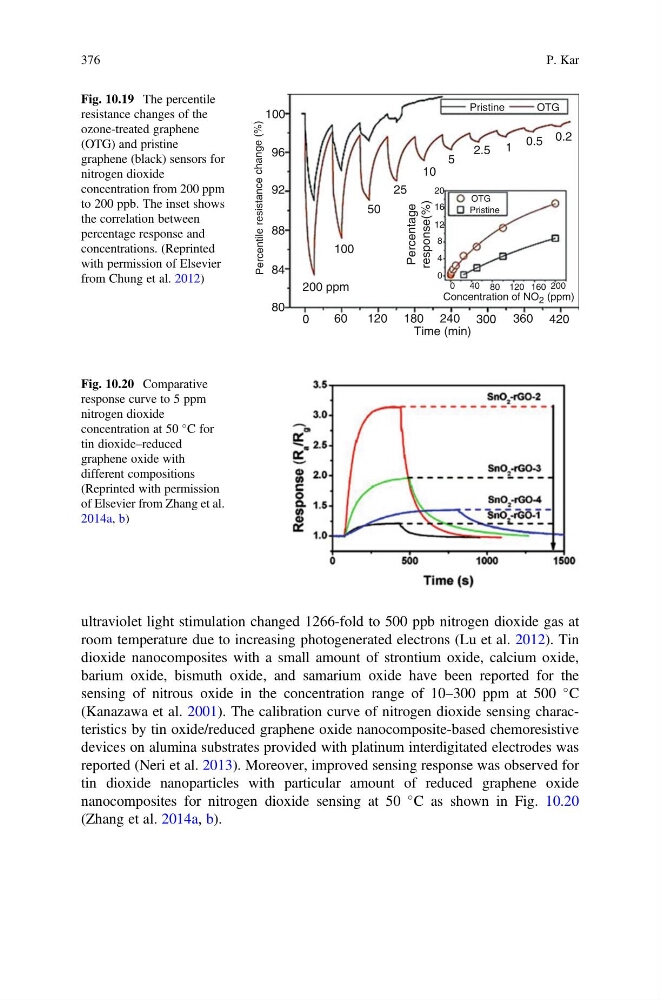
(Kanazawa et al. 2001). The calibration curve of nitrogen dioxide sensing characteristics by tin oxide/reduced graphene oxide nanocomposite-based chemoresistive
devices on alumina substrates provided with platinum interdigitated electrodes was
reported (Neri et al. 2013). Moreover, improved sensing response was observed for
tin dioxide nanoparticles with particular amount of reduced graphene oxide
nanocomposites for nitrogen dioxide sensing at 50
C as shown in Fig. 10.20
(Zhang et al. 2014a, b).
0
60
120 180 240 300 360 420
100
96
92
88
84
80
100
200 ppm
50
25
10
5
2.5 1
0.5 0.2
OTG
20
40 80 120 160 200
16
12
8
4
0
0
Pristine
Pristine
OTG
Time (min)
Concentration of NO 2 (ppm)
Percentage
response(%)
Percentile
resistance
change
(%)
Fig. 10.19 The percentile
resistance changes of the
ozone-treated graphene
(OTG) and pristine
graphene (black) sensors for
nitrogen dioxide
concentration from 200 ppm
to 200 ppb. The inset shows
the correlation between
percentage response and
concentrations. (Reprinted
with permission of Elsevier
from Chung et al. 2012)
Fig. 10.20 Comparative
response curve to 5 ppm
nitrogen dioxide
concentration at 50
C for
tin dioxide–reduced
graphene oxide with
different compositions
(Reprinted with permission
of Elsevier from Zhang et al.
2014a, b)
376
P. Kar
room temperature due to increasing photogenerated electrons (Lu et al. 2012). Tin
dioxide nanocomposites with a small amount of strontium oxide, calcium oxide,
barium oxide, bismuth oxide, and samarium oxide have been reported for the
sensing of nitrous oxide in the concentration range of 10–300 ppm at 500
C
(Kanazawa et al. 2001). The calibration curve of nitrogen dioxide sensing characteristics by tin oxide/reduced graphene oxide nanocomposite-based chemoresistive
devices on alumina substrates provided with platinum interdigitated electrodes was
reported (Neri et al. 2013). Moreover, improved sensing response was observed for
tin dioxide nanoparticles with particular amount of reduced graphene oxide
nanocomposites for nitrogen dioxide sensing at 50
C as shown in Fig. 10.20
(Zhang et al. 2014a, b).
0
60
120 180 240 300 360 420
100
96
92
88
84
80
100
200 ppm
50
25
10
5
2.5 1
0.5 0.2
OTG
20
40 80 120 160 200
16
12
8
4
0
0
Pristine
Pristine
OTG
Time (min)
Concentration of NO 2 (ppm)
Percentage
response(%)
Percentile
resistance
change
(%)
Fig. 10.19 The percentile
resistance changes of the
ozone-treated graphene
(OTG) and pristine
graphene (black) sensors for
nitrogen dioxide
concentration from 200 ppm
to 200 ppb. The inset shows
the correlation between
percentage response and
concentrations. (Reprinted
with permission of Elsevier
from Chung et al. 2012)
Fig. 10.20 Comparative
response curve to 5 ppm
nitrogen dioxide
concentration at 50
C for
tin dioxide–reduced
graphene oxide with
different compositions
(Reprinted with permission
of Elsevier from Zhang et al.
2014a, b)
376
P. Kar