

We evaluate the velocity of magma flow in a
sill, preceding the development of a laccolith, by
putting (12.12) in the following form:
(12.13)
Here 2h and 2a are the thickness and length of the
sill, whereas P t and P f are the magma pressures at
the tip and the feeder. For the Henry Mountains
examples, the sills that developed into the larger
laccoliths formed at about 4 km depth where the
lithostatic pressure would be about P w ϭ 100 MPa.
The magma pressure in excess of the lithostatic
pressure at this depth has been estimated to range
from 30 to 70 MPa, based on the density of the
magma, the density stratification of the host rock,
and the depth to the source of the magma
(Johnson and Pollard, 1973). Taking 50 MPa as representative of this excess pressure, the total
magma pressure at the feeder of the sill would be
P f ϭ 150 MPa. We postulate that the magma pressure would decrease to the lithostatic pressure at
the tip of the sill, so P t ϭ 100 MPa. To be consistent
with the previous section, we use a thickness to
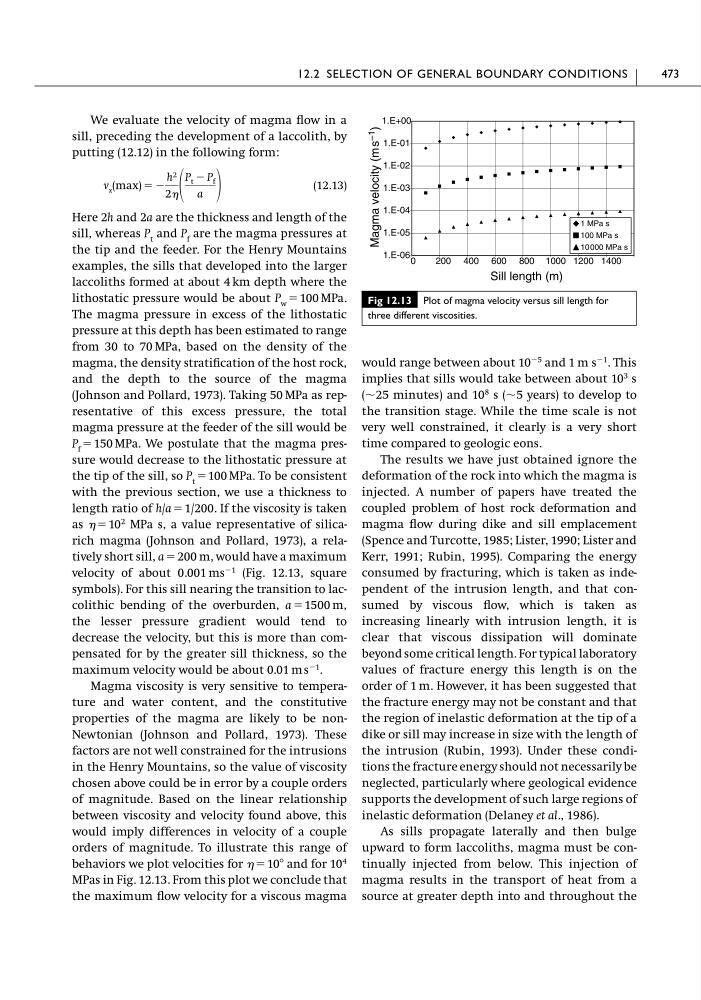
length ratio of h/a ϭ 1/200. If the viscosity is taken
as ϭ 10
2 MPa s, a value representative of silicarich magma (Johnson and Pollard, 1973), a relatively short sill, a ϭ 200 m, would have a maximum
velocity of about 0.001 ms
Ϫ1 (Fig. 12.13, square
symbols). For this sill nearing the transition to laccolithic bending of the overburden, a ϭ 1500 m,
the lesser pressure gradient would tend to
decrease the velocity, but this is more than compensated for by the greater sill thickness, so the
maximum velocity would be about 0.01 m s
Ϫ1 .
Magma viscosity is very sensitive to temperature and water content, and the constitutive
properties of the magma are likely to be nonNewtonian (Johnson and Pollard, 1973). These
factors are not well constrained for the intrusions
in the Henry Mountains, so the value of viscosity
chosen above could be in error by a couple orders
of magnitude. Based on the linear relationship
between viscosity and velocity found above, this
would imply differences in velocity of a couple
orders of magnitude. To illustrate this range of
behaviors we plot velocities for ϭ 10Њ and for 10
4
MPas in Fig. 12.13. From this plot we conclude that
the maximum flow velocity for a viscous magma
v x (max) ϭ Ϫ
h 2
2
P t Ϫ P f
a
would range between about 10
Ϫ5 and 1 m s
Ϫ1 . This
implies that sills would take between about 10
3 s
(ϳ25 minutes) and 10
8 s (ϳ5 years) to develop to
the transition stage. While the time scale is not
very well constrained, it clearly is a very short
time compared to geologic eons.
The results we have just obtained ignore the
deformation of the rock into which the magma is
injected. A number of papers have treated the
coupled problem of host rock deformation and
magma flow during dike and sill emplacement
(Spence and Turcotte, 1985; Lister, 1990; Lister and
Kerr, 1991; Rubin, 1995). Comparing the energy
consumed by fracturing, which is taken as independent of the intrusion length, and that consumed by viscous flow, which is taken as
increasing linearly with intrusion length, it is
clear that viscous dissipation will dominate
beyond some critical length. For typical laboratory
values of fracture energy this length is on the
order of 1 m. However, it has been suggested that
the fracture energy may not be constant and that
the region of inelastic deformation at the tip of a
dike or sill may increase in size with the length of
the intrusion (Rubin, 1993). Under these conditions the fracture energy should not necessarily be
neglected, particularly where geological evidence
supports the development of such large regions of
inelastic deformation (Delaney et al., 1986).
As sills propagate laterally and then bulge
upward to form laccoliths, magma must be continually injected from below. This injection of
magma results in the transport of heat from a
source at greater depth into and throughout the
12.2 SELECTION OF GENERAL BOUNDARY CONDITIONS
473
Fig 12.13 Plot of magma velocity versus sill length for
three different viscosities.
1.E-06
1.E-05
1.E-04
1.E-03
1.E-02
1.E-01
1.E+00
0
200 400 600 800 1000 1200 1400
1 MPa s
100 MPa s
10000 MPa s
Sill length (m)
Magma velocity (m s –1
)
sill, preceding the development of a laccolith, by
putting (12.12) in the following form:
(12.13)
Here 2h and 2a are the thickness and length of the
sill, whereas P t and P f are the magma pressures at
the tip and the feeder. For the Henry Mountains
examples, the sills that developed into the larger
laccoliths formed at about 4 km depth where the
lithostatic pressure would be about P w ϭ 100 MPa.
The magma pressure in excess of the lithostatic
pressure at this depth has been estimated to range
from 30 to 70 MPa, based on the density of the
magma, the density stratification of the host rock,
and the depth to the source of the magma
(Johnson and Pollard, 1973). Taking 50 MPa as representative of this excess pressure, the total
magma pressure at the feeder of the sill would be
P f ϭ 150 MPa. We postulate that the magma pressure would decrease to the lithostatic pressure at
the tip of the sill, so P t ϭ 100 MPa. To be consistent
with the previous section, we use a thickness to
length ratio of h/a ϭ 1/200. If the viscosity is taken
as ϭ 10
2 MPa s, a value representative of silicarich magma (Johnson and Pollard, 1973), a relatively short sill, a ϭ 200 m, would have a maximum
velocity of about 0.001 ms
Ϫ1 (Fig. 12.13, square
symbols). For this sill nearing the transition to laccolithic bending of the overburden, a ϭ 1500 m,
the lesser pressure gradient would tend to
decrease the velocity, but this is more than compensated for by the greater sill thickness, so the
maximum velocity would be about 0.01 m s
Ϫ1 .
Magma viscosity is very sensitive to temperature and water content, and the constitutive
properties of the magma are likely to be nonNewtonian (Johnson and Pollard, 1973). These
factors are not well constrained for the intrusions
in the Henry Mountains, so the value of viscosity
chosen above could be in error by a couple orders
of magnitude. Based on the linear relationship
between viscosity and velocity found above, this
would imply differences in velocity of a couple
orders of magnitude. To illustrate this range of
behaviors we plot velocities for ϭ 10Њ and for 10
4
MPas in Fig. 12.13. From this plot we conclude that
the maximum flow velocity for a viscous magma
v x (max) ϭ Ϫ
h 2
2
P t Ϫ P f
a
would range between about 10
Ϫ5 and 1 m s
Ϫ1 . This
implies that sills would take between about 10
3 s
(ϳ25 minutes) and 10
8 s (ϳ5 years) to develop to
the transition stage. While the time scale is not
very well constrained, it clearly is a very short
time compared to geologic eons.
The results we have just obtained ignore the
deformation of the rock into which the magma is
injected. A number of papers have treated the
coupled problem of host rock deformation and
magma flow during dike and sill emplacement
(Spence and Turcotte, 1985; Lister, 1990; Lister and
Kerr, 1991; Rubin, 1995). Comparing the energy
consumed by fracturing, which is taken as independent of the intrusion length, and that consumed by viscous flow, which is taken as
increasing linearly with intrusion length, it is
clear that viscous dissipation will dominate
beyond some critical length. For typical laboratory
values of fracture energy this length is on the
order of 1 m. However, it has been suggested that
the fracture energy may not be constant and that
the region of inelastic deformation at the tip of a
dike or sill may increase in size with the length of
the intrusion (Rubin, 1993). Under these conditions the fracture energy should not necessarily be
neglected, particularly where geological evidence
supports the development of such large regions of
inelastic deformation (Delaney et al., 1986).
As sills propagate laterally and then bulge
upward to form laccoliths, magma must be continually injected from below. This injection of
magma results in the transport of heat from a
source at greater depth into and throughout the
12.2 SELECTION OF GENERAL BOUNDARY CONDITIONS
473
Fig 12.13 Plot of magma velocity versus sill length for
three different viscosities.
1.E-06
1.E-05
1.E-04
1.E-03
1.E-02
1.E-01
1.E+00
0
200 400 600 800 1000 1200 1400
1 MPa s
100 MPa s
10000 MPa s
Sill length (m)
Magma velocity (m s –1
)