

faulting, whereas the component of compressive
normal stress, zz , would resist faulting (Segall and
Pollard, 1980; Oppenheimer et al., 1988). The relationship that quantifies this tendency for faulting
is based on the Coulomb criterion (see Chapter 9)
and is measured as the Coulomb stress, C , which
is calculated following (9.40):
(12.9)
Here i is the coefficient of internal friction; r and
w are the average mass density of the host rock and
the groundwater, respectively; and g* is the magnitude of the near-surface acceleration of gravity.
Note that the normal stress is a combination of the
C ϭ | zx | ϩ i [ zz ϩ ( r Ϫ w )g*z]
normal stress induced by opening of the sill (the
supplementary stress state) and the ambient
normal stress due to the weight of overburden
(Anderson’s standard state). The pore fluid pressure from a hydrostatic column of groundwater
with water table at the free surface of the halfspace reduces this normal stress to an effective
normal stress. For the calculations used to produce
Fig. 12.11 the constants are i ϭ 0.85 and ( r Ϫ w ) ϭ
1.4 ϫ 10
3 kg m
Ϫ3 .
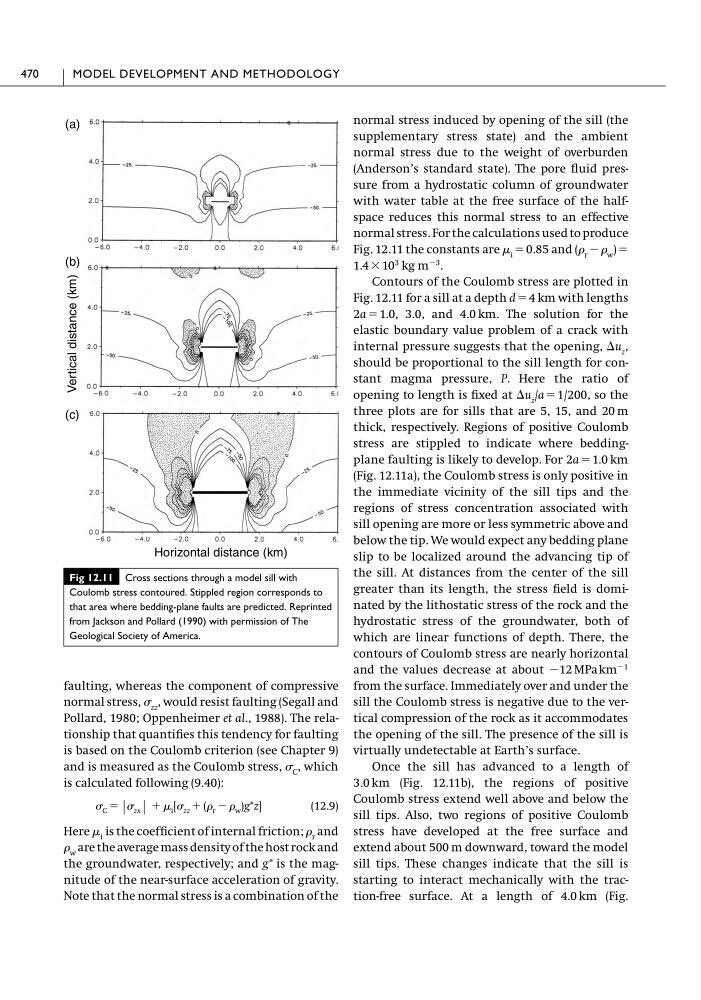
Contours of the Coulomb stress are plotted in
Fig. 12.11 for a sill at a depth d ϭ 4 km with lengths
2a ϭ 1.0, 3.0, and 4.0 km. The solution for the
elastic boundary value problem of a crack with
internal pressure suggests that the opening, ⌬u z ,
should be proportional to the sill length for constant magma pressure, P. Here the ratio of
opening to length is fixed at ⌬u z /a ϭ 1/200, so the
three plots are for sills that are 5, 15, and 20 m
thick, respectively. Regions of positive Coulomb
stress are stippled to indicate where beddingplane faulting is likely to develop. For 2a ϭ 1.0 km
(Fig. 12.11a), the Coulomb stress is only positive in
the immediate vicinity of the sill tips and the
regions of stress concentration associated with
sill opening are more or less symmetric above and
below the tip. We would expect any bedding plane
slip to be localized around the advancing tip of
the sill. At distances from the center of the sill
greater than its length, the stress field is dominated by the lithostatic stress of the rock and the
hydrostatic stress of the groundwater, both of
which are linear functions of depth. There, the
contours of Coulomb stress are nearly horizontal
and the values decrease at about Ϫ12 MPa km
Ϫ1
from the surface. Immediately over and under the
sill the Coulomb stress is negative due to the vertical compression of the rock as it accommodates
the opening of the sill. The presence of the sill is
virtually undetectable at Earth’s surface.
Once the sill has advanced to a length of
3.0 km (Fig. 12.11b), the regions of positive
Coulomb stress extend well above and below the
sill tips. Also, two regions of positive Coulomb
stress have developed at the free surface and
extend about 500 m downward, toward the model
sill tips. These changes indicate that the sill is
starting to interact mechanically with the traction-free surface. At a length of 4.0 km (Fig.
470
MODEL DEVELOPMENT AND METHODOLOGY
Fig 12.11 Cross sections through a model sill with
Coulomb stress contoured. Stippled region corresponds to
that area where bedding-plane faults are predicted. Reprinted
from Jackson and Pollard (1990) with permission of The
Geological Society of America.
Vertical distance (km)
Horizontal distance (km)
(a)
(b)
(c)
normal stress, zz , would resist faulting (Segall and
Pollard, 1980; Oppenheimer et al., 1988). The relationship that quantifies this tendency for faulting
is based on the Coulomb criterion (see Chapter 9)
and is measured as the Coulomb stress, C , which
is calculated following (9.40):
(12.9)
Here i is the coefficient of internal friction; r and
w are the average mass density of the host rock and
the groundwater, respectively; and g* is the magnitude of the near-surface acceleration of gravity.
Note that the normal stress is a combination of the
C ϭ | zx | ϩ i [ zz ϩ ( r Ϫ w )g*z]
normal stress induced by opening of the sill (the
supplementary stress state) and the ambient
normal stress due to the weight of overburden
(Anderson’s standard state). The pore fluid pressure from a hydrostatic column of groundwater
with water table at the free surface of the halfspace reduces this normal stress to an effective
normal stress. For the calculations used to produce
Fig. 12.11 the constants are i ϭ 0.85 and ( r Ϫ w ) ϭ
1.4 ϫ 10
3 kg m
Ϫ3 .
Contours of the Coulomb stress are plotted in
Fig. 12.11 for a sill at a depth d ϭ 4 km with lengths
2a ϭ 1.0, 3.0, and 4.0 km. The solution for the
elastic boundary value problem of a crack with
internal pressure suggests that the opening, ⌬u z ,
should be proportional to the sill length for constant magma pressure, P. Here the ratio of
opening to length is fixed at ⌬u z /a ϭ 1/200, so the
three plots are for sills that are 5, 15, and 20 m
thick, respectively. Regions of positive Coulomb
stress are stippled to indicate where beddingplane faulting is likely to develop. For 2a ϭ 1.0 km
(Fig. 12.11a), the Coulomb stress is only positive in
the immediate vicinity of the sill tips and the
regions of stress concentration associated with
sill opening are more or less symmetric above and
below the tip. We would expect any bedding plane
slip to be localized around the advancing tip of
the sill. At distances from the center of the sill
greater than its length, the stress field is dominated by the lithostatic stress of the rock and the
hydrostatic stress of the groundwater, both of
which are linear functions of depth. There, the
contours of Coulomb stress are nearly horizontal
and the values decrease at about Ϫ12 MPa km
Ϫ1
from the surface. Immediately over and under the
sill the Coulomb stress is negative due to the vertical compression of the rock as it accommodates
the opening of the sill. The presence of the sill is
virtually undetectable at Earth’s surface.
Once the sill has advanced to a length of
3.0 km (Fig. 12.11b), the regions of positive
Coulomb stress extend well above and below the
sill tips. Also, two regions of positive Coulomb
stress have developed at the free surface and
extend about 500 m downward, toward the model
sill tips. These changes indicate that the sill is
starting to interact mechanically with the traction-free surface. At a length of 4.0 km (Fig.
470
MODEL DEVELOPMENT AND METHODOLOGY
Fig 12.11 Cross sections through a model sill with
Coulomb stress contoured. Stippled region corresponds to
that area where bedding-plane faults are predicted. Reprinted
from Jackson and Pollard (1990) with permission of The
Geological Society of America.
Vertical distance (km)
Horizontal distance (km)
(a)
(b)
(c)