

identify the positions of outcrops or sampling
localities, or simply to avoid getting lost! For
mapping or sampling on the Earth’s surface it is
common to use a geographic coordinate system
based on lines of constant latitude and longitude
(Fig. 2.1a). Lines of constant latitude trend from
east to west and are numbered in degrees, 0 to 90Њ,
both north and south from the equator to the
poles. Lines of constant longitude trend from
north to south and pass through the poles. They
are numbered in degrees, 0 to 180Њ, both east and
west from Greenwich, UK, so there are 360Њ in
total. To be more precise in locating position on
the Earth’s surface, each degree is subdivided into
sixty minutes (1Њϭ60Ј) and each minute is subdivided into sixty seconds (1Јϭ60Љ).
The scheme of subdividing circles, such as the
lines of latitude or longitude, into 360 sectors
dates back at least to the ancient Babylonians
(Beckmann, 1971), who used a base 60 numbering
system. Imagine having to recall sixty different
names for your basic counting numbers! The
Babylonians knew that the perimeter of a hexagon
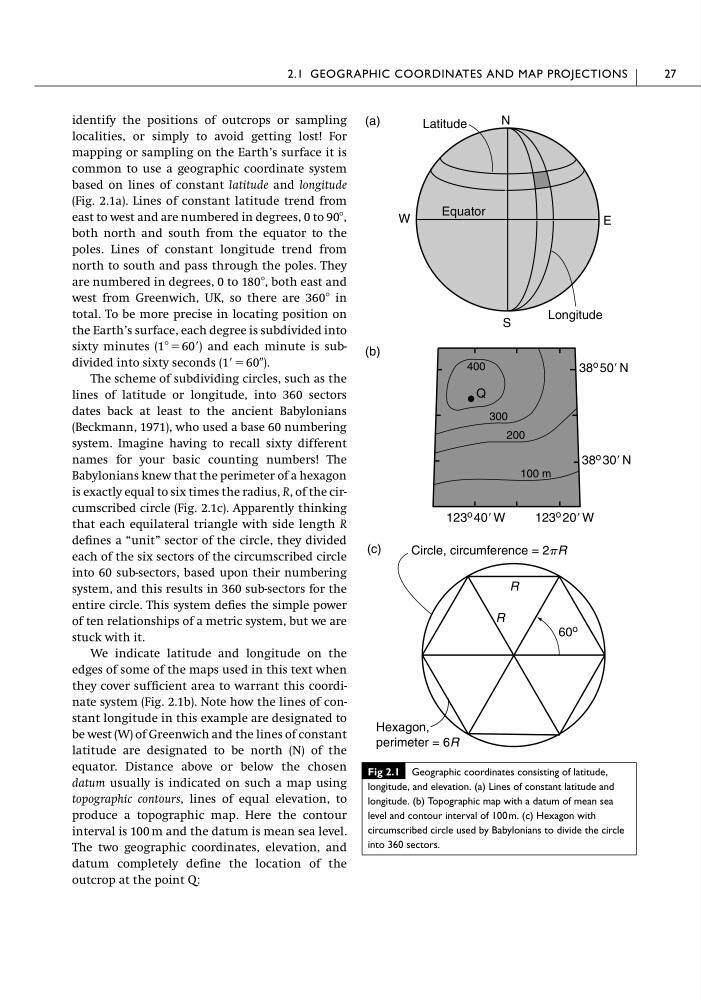
is exactly equal to six times the radius, R, of the circumscribed circle (Fig. 2.1c). Apparently thinking
that each equilateral triangle with side length R
defines a “unit” sector of the circle, they divided
each of the six sectors of the circumscribed circle
into 60 sub-sectors, based upon their numbering
system, and this results in 360 sub-sectors for the
entire circle. This system defies the simple power
of ten relationships of a metric system, but we are
stuck with it.
We indicate latitude and longitude on the
edges of some of the maps used in this text when
they cover sufficient area to warrant this coordinate system (Fig. 2.1b). Note how the lines of constant longitude in this example are designated to
be west (W) of Greenwich and the lines of constant
latitude are designated to be north (N) of the
equator. Distance above or below the chosen
datum usually is indicated on such a map using
topographic contours, lines of equal elevation, to
produce a topographic map. Here the contour
interval is 100 m and the datum is mean sea level.
The two geographic coordinates, elevation, and
datum completely define the location of the
outcrop at the point Q:
2.1 GEOGRAPHIC COORDINATES AND MAP PROJECTIONS
27
(a)
N
S
W
E
Latitude
Longitude
Equator
(c)
Circle, circumference = 2pR
Hexagon,
perimeter = 6R
R
R
(b)
Q
100 m
200
300
400
38 o 50Ј N
38 o 30Ј N
123 o 20Ј W
123 o 40Ј W
60 o
Fig 2.1 Geographic coordinates consisting of latitude,
longitude, and elevation. (a) Lines of constant latitude and
longitude. (b) Topographic map with a datum of mean sea
level and contour interval of 100m. (c) Hexagon with
circumscribed circle used by Babylonians to divide the circle
into 360 sectors.
localities, or simply to avoid getting lost! For
mapping or sampling on the Earth’s surface it is
common to use a geographic coordinate system
based on lines of constant latitude and longitude
(Fig. 2.1a). Lines of constant latitude trend from
east to west and are numbered in degrees, 0 to 90Њ,
both north and south from the equator to the
poles. Lines of constant longitude trend from
north to south and pass through the poles. They
are numbered in degrees, 0 to 180Њ, both east and
west from Greenwich, UK, so there are 360Њ in
total. To be more precise in locating position on
the Earth’s surface, each degree is subdivided into
sixty minutes (1Њϭ60Ј) and each minute is subdivided into sixty seconds (1Јϭ60Љ).
The scheme of subdividing circles, such as the
lines of latitude or longitude, into 360 sectors
dates back at least to the ancient Babylonians
(Beckmann, 1971), who used a base 60 numbering
system. Imagine having to recall sixty different
names for your basic counting numbers! The
Babylonians knew that the perimeter of a hexagon
is exactly equal to six times the radius, R, of the circumscribed circle (Fig. 2.1c). Apparently thinking
that each equilateral triangle with side length R
defines a “unit” sector of the circle, they divided
each of the six sectors of the circumscribed circle
into 60 sub-sectors, based upon their numbering
system, and this results in 360 sub-sectors for the
entire circle. This system defies the simple power
of ten relationships of a metric system, but we are
stuck with it.
We indicate latitude and longitude on the
edges of some of the maps used in this text when
they cover sufficient area to warrant this coordinate system (Fig. 2.1b). Note how the lines of constant longitude in this example are designated to
be west (W) of Greenwich and the lines of constant
latitude are designated to be north (N) of the
equator. Distance above or below the chosen
datum usually is indicated on such a map using
topographic contours, lines of equal elevation, to
produce a topographic map. Here the contour
interval is 100 m and the datum is mean sea level.
The two geographic coordinates, elevation, and
datum completely define the location of the
outcrop at the point Q:
2.1 GEOGRAPHIC COORDINATES AND MAP PROJECTIONS
27
(a)
N
S
W
E
Latitude
Longitude
Equator
(c)
Circle, circumference = 2pR
Hexagon,
perimeter = 6R
R
R
(b)
Q
100 m
200
300
400
38 o 50Ј N
38 o 30Ј N
123 o 20Ј W
123 o 40Ј W
60 o
Fig 2.1 Geographic coordinates consisting of latitude,
longitude, and elevation. (a) Lines of constant latitude and
longitude. (b) Topographic map with a datum of mean sea
level and contour interval of 100m. (c) Hexagon with
circumscribed circle used by Babylonians to divide the circle
into 360 sectors.