

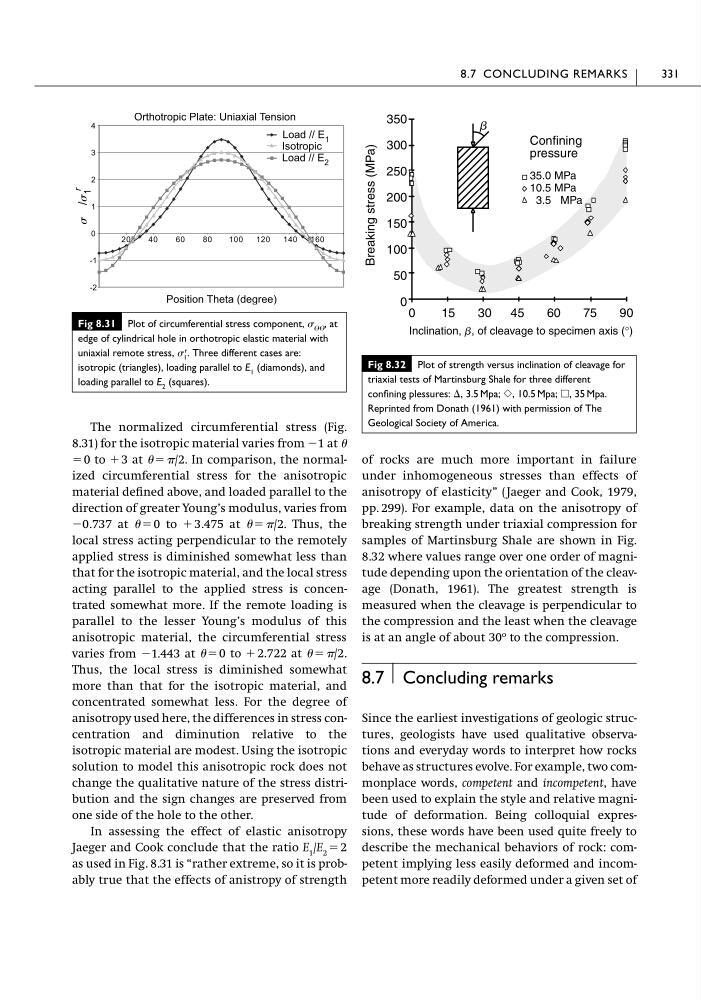
The normalized circumferential stress (Fig.
8.31) for the isotropic material varies from Ϫ1 at
ϭ 0 to ϩ3 at ϭ /2. In comparison, the normalized circumferential stress for the anisotropic
material defined above, and loaded parallel to the
direction of greater Young’s modulus, varies from
Ϫ0.737 at ϭ 0 to ϩ 3.475 at ϭ /2. Thus, the
local stress acting perpendicular to the remotely
applied stress is diminished somewhat less than
that for the isotropic material, and the local stress
acting parallel to the applied stress is concentrated somewhat more. If the remote loading is
parallel to the lesser Young’s modulus of this
anisotropic material, the circumferential stress
varies from Ϫ1.443 at ϭ 0 to ϩ 2.722 at ϭ /2.
Thus, the local stress is diminished somewhat
more than that for the isotropic material, and
concentrated somewhat less. For the degree of
anisotropy used here, the differences in stress concentration and diminution relative to the
isotropic material are modest. Using the isotropic
solution to model this anisotropic rock does not
change the qualitative nature of the stress distribution and the sign changes are preserved from
one side of the hole to the other.
In assessing the effect of elastic anisotropy
Jaeger and Cook conclude that the ratio E 1 /E 2 ϭ 2
as used in Fig. 8.31 is “rather extreme, so it is probably true that the effects of anistropy of strength
of rocks are much more important in failure
under inhomogeneous stresses than effects of
anisotropy of elasticity” (Jaeger and Cook, 1979,
pp. 299). For example, data on the anisotropy of
breaking strength under triaxial compression for
samples of Martinsburg Shale are shown in Fig.
8.32 where values range over one order of magnitude depending upon the orientation of the cleavage (Donath, 1961). The greatest strength is
measured when the cleavage is perpendicular to
the compression and the least when the cleavage
is at an angle of about 30
o to the compression.
8.7 Concluding remarks
Since the earliest investigations of geologic structures, geologists have used qualitative observations and everyday words to interpret how rocks
behave as structures evolve. For example, two commonplace words, competent and incompetent, have
been used to explain the style and relative magnitude of deformation. Being colloquial expressions, these words have been used quite freely to
describe the mechanical behaviors of rock: competent implying less easily deformed and incompetent more readily deformed under a given set of
8.7 CONCLUDING REMARKS
331
Fig 8.31 Plot of circumferential stress component, ⍜⍜ , at
edge of cylindrical hole in orthotropic elastic material with
uniaxial remote stress, 1
r
. Three different cases are:
isotropic (triangles), loading parallel to E 1 (diamonds), and
loading parallel to E 2 (squares).
-2
-1
0
1
2
3
4
20
40
60
80
100
120
140
160
Load // E 2
Orthotropic Plate: Uniaxial Tension
Position Theta (degree)
Isotropic
� /�
1
r
Load // E 1
Fig 8.32 Plot of strength versus inclination of cleavage for
triaxial tests of Martinsburg Shale for three different
confining plessures: ⌬, 3.5 Mpa; ᭛, 10.5 Mpa; ᮀ, 35 Mpa.
Reprinted from Donath (1961) with permission of The
Geological Society of America.
b
Breaking stress (MPa)
Confining
pressure
35.0 MPa
10.5 MPa
3.5 MPa
350
300
250
200
150
100
50
0 0 o
15 o 30 o 45 o 60 o 75 o 90 o
Inclination, b, of cleavage to specimen axis (°)
8.31) for the isotropic material varies from Ϫ1 at
ϭ 0 to ϩ3 at ϭ /2. In comparison, the normalized circumferential stress for the anisotropic
material defined above, and loaded parallel to the
direction of greater Young’s modulus, varies from
Ϫ0.737 at ϭ 0 to ϩ 3.475 at ϭ /2. Thus, the
local stress acting perpendicular to the remotely
applied stress is diminished somewhat less than
that for the isotropic material, and the local stress
acting parallel to the applied stress is concentrated somewhat more. If the remote loading is
parallel to the lesser Young’s modulus of this
anisotropic material, the circumferential stress
varies from Ϫ1.443 at ϭ 0 to ϩ 2.722 at ϭ /2.
Thus, the local stress is diminished somewhat
more than that for the isotropic material, and
concentrated somewhat less. For the degree of
anisotropy used here, the differences in stress concentration and diminution relative to the
isotropic material are modest. Using the isotropic
solution to model this anisotropic rock does not
change the qualitative nature of the stress distribution and the sign changes are preserved from
one side of the hole to the other.
In assessing the effect of elastic anisotropy
Jaeger and Cook conclude that the ratio E 1 /E 2 ϭ 2
as used in Fig. 8.31 is “rather extreme, so it is probably true that the effects of anistropy of strength
of rocks are much more important in failure
under inhomogeneous stresses than effects of
anisotropy of elasticity” (Jaeger and Cook, 1979,
pp. 299). For example, data on the anisotropy of
breaking strength under triaxial compression for
samples of Martinsburg Shale are shown in Fig.
8.32 where values range over one order of magnitude depending upon the orientation of the cleavage (Donath, 1961). The greatest strength is
measured when the cleavage is perpendicular to
the compression and the least when the cleavage
is at an angle of about 30
o to the compression.
8.7 Concluding remarks
Since the earliest investigations of geologic structures, geologists have used qualitative observations and everyday words to interpret how rocks
behave as structures evolve. For example, two commonplace words, competent and incompetent, have
been used to explain the style and relative magnitude of deformation. Being colloquial expressions, these words have been used quite freely to
describe the mechanical behaviors of rock: competent implying less easily deformed and incompetent more readily deformed under a given set of
8.7 CONCLUDING REMARKS
331
Fig 8.31 Plot of circumferential stress component, ⍜⍜ , at
edge of cylindrical hole in orthotropic elastic material with
uniaxial remote stress, 1
r
. Three different cases are:
isotropic (triangles), loading parallel to E 1 (diamonds), and
loading parallel to E 2 (squares).
-2
-1
0
1
2
3
4
20
40
60
80
100
120
140
160
Load // E 2
Orthotropic Plate: Uniaxial Tension
Position Theta (degree)
Isotropic
� /�
1
r
Load // E 1
Fig 8.32 Plot of strength versus inclination of cleavage for
triaxial tests of Martinsburg Shale for three different
confining plessures: ⌬, 3.5 Mpa; ᭛, 10.5 Mpa; ᮀ, 35 Mpa.
Reprinted from Donath (1961) with permission of The
Geological Society of America.
b
Breaking stress (MPa)
Confining
pressure
35.0 MPa
10.5 MPa
3.5 MPa
350
300
250
200
150
100
50
0 0 o
15 o 30 o 45 o 60 o 75 o 90 o
Inclination, b, of cleavage to specimen axis (°)