

in the groundwater, the material to either side of
the solution surface moved inward. Note how the
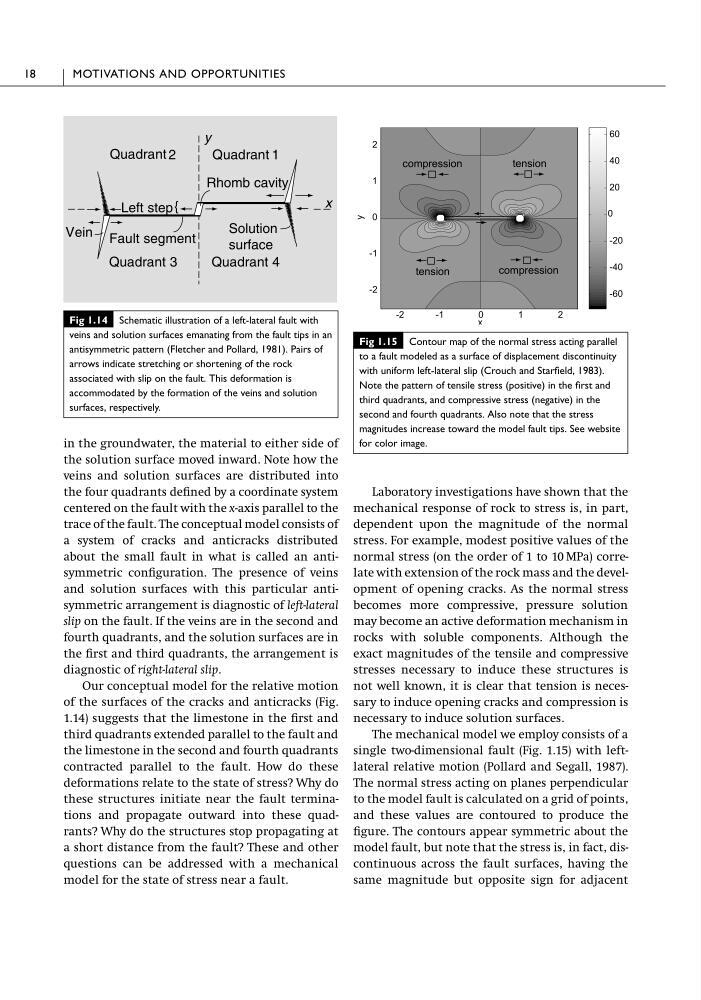
veins and solution surfaces are distributed into
the four quadrants defined by a coordinate system
centered on the fault with the x-axis parallel to the
trace of the fault. The conceptual model consists of
a system of cracks and anticracks distributed
about the small fault in what is called an antisymmetric configuration. The presence of veins
and solution surfaces with this particular antisymmetric arrangement is diagnostic of left-lateral
slip on the fault. If the veins are in the second and
fourth quadrants, and the solution surfaces are in
the first and third quadrants, the arrangement is
diagnostic of right-lateral slip.
Our conceptual model for the relative motion
of the surfaces of the cracks and anticracks (Fig.
1.14) suggests that the limestone in the first and
third quadrants extended parallel to the fault and
the limestone in the second and fourth quadrants
contracted parallel to the fault. How do these
deformations relate to the state of stress? Why do
these structures initiate near the fault terminations and propagate outward into these quadrants? Why do the structures stop propagating at
a short distance from the fault? These and other
questions can be addressed with a mechanical
model for the state of stress near a fault.
Laboratory investigations have shown that the
mechanical response of rock to stress is, in part,
dependent upon the magnitude of the normal
stress. For example, modest positive values of the
normal stress (on the order of 1 to 10 MPa) correlate with extension of the rock mass and the development of opening cracks. As the normal stress
becomes more compressive, pressure solution
may become an active deformation mechanism in
rocks with soluble components. Although the
exact magnitudes of the tensile and compressive
stresses necessary to induce these structures is
not well known, it is clear that tension is necessary to induce opening cracks and compression is
necessary to induce solution surfaces.
The mechanical model we employ consists of a
single two-dimensional fault (Fig. 1.15) with leftlateral relative motion (Pollard and Segall, 1987).
The normal stress acting on planes perpendicular
to the model fault is calculated on a grid of points,
and these values are contoured to produce the
figure. The contours appear symmetric about the
model fault, but note that the stress is, in fact, discontinuous across the fault surfaces, having the
same magnitude but opposite sign for adjacent
18
MOTIVATIONS AND OPPORTUNITIES
Quadrant 1
Quadrant 2
Quadrant 3
Quadrant 4
y
x
{
Rhomb cavity
Left step
Fault segment
Vein
Solution
surface
Fig 1.14 Schematic illustration of a left-lateral fault with
veins and solution surfaces emanating from the fault tips in an
antisymmetric pattern (Fletcher and Pollard, 1981). Pairs of
arrows indicate stretching or shortening of the rock
associated with slip on the fault. This deformation is
accommodated by the formation of the veins and solution
surfaces, respectively.
-60
-40
-20
0
20
40
60
-2
-1
0
1
2
-2
-1
0
1
2
x
y
tension
tension
compression
compression
Fig 1.15 Contour map of the normal stress acting parallel
to a fault modeled as a surface of displacement discontinuity
with uniform left-lateral slip (Crouch and Starfield, 1983).
Note the pattern of tensile stress (positive) in the first and
third quadrants, and compressive stress (negative) in the
second and fourth quadrants. Also note that the stress
magnitudes increase toward the model fault tips. See website
for color image.
the solution surface moved inward. Note how the
veins and solution surfaces are distributed into
the four quadrants defined by a coordinate system
centered on the fault with the x-axis parallel to the
trace of the fault. The conceptual model consists of
a system of cracks and anticracks distributed
about the small fault in what is called an antisymmetric configuration. The presence of veins
and solution surfaces with this particular antisymmetric arrangement is diagnostic of left-lateral
slip on the fault. If the veins are in the second and
fourth quadrants, and the solution surfaces are in
the first and third quadrants, the arrangement is
diagnostic of right-lateral slip.
Our conceptual model for the relative motion
of the surfaces of the cracks and anticracks (Fig.
1.14) suggests that the limestone in the first and
third quadrants extended parallel to the fault and
the limestone in the second and fourth quadrants
contracted parallel to the fault. How do these
deformations relate to the state of stress? Why do
these structures initiate near the fault terminations and propagate outward into these quadrants? Why do the structures stop propagating at
a short distance from the fault? These and other
questions can be addressed with a mechanical
model for the state of stress near a fault.
Laboratory investigations have shown that the
mechanical response of rock to stress is, in part,
dependent upon the magnitude of the normal
stress. For example, modest positive values of the
normal stress (on the order of 1 to 10 MPa) correlate with extension of the rock mass and the development of opening cracks. As the normal stress
becomes more compressive, pressure solution
may become an active deformation mechanism in
rocks with soluble components. Although the
exact magnitudes of the tensile and compressive
stresses necessary to induce these structures is
not well known, it is clear that tension is necessary to induce opening cracks and compression is
necessary to induce solution surfaces.
The mechanical model we employ consists of a
single two-dimensional fault (Fig. 1.15) with leftlateral relative motion (Pollard and Segall, 1987).
The normal stress acting on planes perpendicular
to the model fault is calculated on a grid of points,
and these values are contoured to produce the
figure. The contours appear symmetric about the
model fault, but note that the stress is, in fact, discontinuous across the fault surfaces, having the
same magnitude but opposite sign for adjacent
18
MOTIVATIONS AND OPPORTUNITIES
Quadrant 1
Quadrant 2
Quadrant 3
Quadrant 4
y
x
{
Rhomb cavity
Left step
Fault segment
Vein
Solution
surface
Fig 1.14 Schematic illustration of a left-lateral fault with
veins and solution surfaces emanating from the fault tips in an
antisymmetric pattern (Fletcher and Pollard, 1981). Pairs of
arrows indicate stretching or shortening of the rock
associated with slip on the fault. This deformation is
accommodated by the formation of the veins and solution
surfaces, respectively.
-60
-40
-20
0
20
40
60
-2
-1
0
1
2
-2
-1
0
1
2
x
y
tension
tension
compression
compression
Fig 1.15 Contour map of the normal stress acting parallel
to a fault modeled as a surface of displacement discontinuity
with uniform left-lateral slip (Crouch and Starfield, 1983).
Note the pattern of tensile stress (positive) in the first and
third quadrants, and compressive stress (negative) in the
second and fourth quadrants. Also note that the stress
magnitudes increase toward the model fault tips. See website
for color image.