

volume of rock. The seismic section in Fig. 1.9 has
been combined with hundreds of additional sections surveyed both parallel and perpendicular to
this one. Using such three-dimensional surveys
the opportunity exists to characterize and map
the three-dimensional geometry of the faults.
Both the acquisition and the processing of
seismic reflection data are in the domain of geophysics so we will not dwell on this aspect of the
subject. On the other hand the images captured
by these surveys illuminate both the sedimentological and the structural heterogeneities in
the rock mass. These images have provided us
with the challenging problem of understanding
folding and faulting in three dimensions, no
longer limited by poor exposure and arbitrary erosional slices through these structures. Instead of
searching for the few exposures of a poorly
revealed fault, hoping to measure the offset of one
or two geological markers, we are able to measure
the offset of continuous reflecting horizons at
many points across a fault. Instead of locating the
two points in space that represent the fault terminations at either end of an exposed fault trace, we
are able to locate the fault tipline at many points in
three dimensions. Of course there is a limit to the
resolution of these images, now about 10-m offset
for good reflectors, but the techniques are improving yearly.
1.3.1 Conceptual and mechanical models
for fault linkage
As an example of using structural geology to
analyze three-dimensional seismic data we turn to
the Oseberg Syd Field operated by the Norwegian
company Norsk Hydro (Faerseth et al., 1997). The
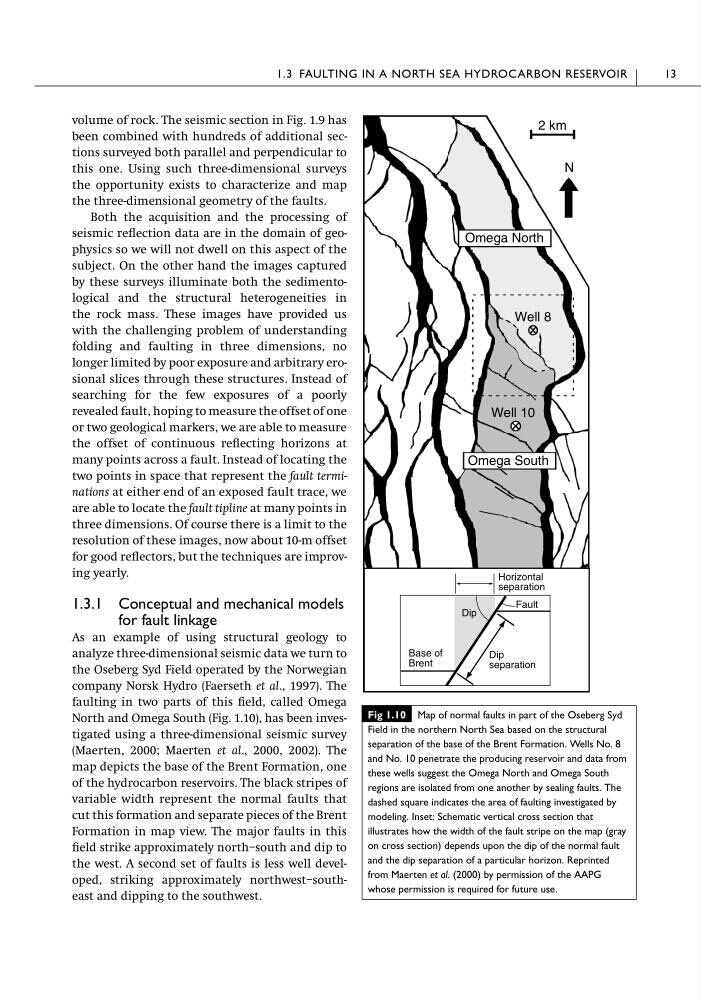
faulting in two parts of this field, called Omega
North and Omega South (Fig. 1.10), has been investigated using a three-dimensional seismic survey
(Maerten, 2000; Maerten et al., 2000, 2002). The
map depicts the base of the Brent Formation, one
of the hydrocarbon reservoirs. The black stripes of
variable width represent the normal faults that
cut this formation and separate pieces of the Brent
Formation in map view. The major faults in this
field strike approximately north–south and dip to
the west. A second set of faults is less well developed, striking approximately northwest–southeast and dipping to the southwest.
1.3 FAULTING IN A NORTH SEA HYDROCARBON RESERVOIR
13
2 km
Omega North
Well 8
Well 10
Omega South
N
Base of
Brent
Fault
Dip
Dip
separation
Horizontal
separation
Fig 1.10 Map of normal faults in part of the Oseberg Syd
Field in the northern North Sea based on the structural
separation of the base of the Brent Formation. Wells No. 8
and No. 10 penetrate the producing reservoir and data from
these wells suggest the Omega North and Omega South
regions are isolated from one another by sealing faults. The
dashed square indicates the area of faulting investigated by
modeling. Inset: Schematic vertical cross section that
illustrates how the width of the fault stripe on the map (gray
on cross section) depends upon the dip of the normal fault
and the dip separation of a particular horizon. Reprinted
from Maerten et al. (2000) by permission of the AAPG
whose permission is required for future use.
been combined with hundreds of additional sections surveyed both parallel and perpendicular to
this one. Using such three-dimensional surveys
the opportunity exists to characterize and map
the three-dimensional geometry of the faults.
Both the acquisition and the processing of
seismic reflection data are in the domain of geophysics so we will not dwell on this aspect of the
subject. On the other hand the images captured
by these surveys illuminate both the sedimentological and the structural heterogeneities in
the rock mass. These images have provided us
with the challenging problem of understanding
folding and faulting in three dimensions, no
longer limited by poor exposure and arbitrary erosional slices through these structures. Instead of
searching for the few exposures of a poorly
revealed fault, hoping to measure the offset of one
or two geological markers, we are able to measure
the offset of continuous reflecting horizons at
many points across a fault. Instead of locating the
two points in space that represent the fault terminations at either end of an exposed fault trace, we
are able to locate the fault tipline at many points in
three dimensions. Of course there is a limit to the
resolution of these images, now about 10-m offset
for good reflectors, but the techniques are improving yearly.
1.3.1 Conceptual and mechanical models
for fault linkage
As an example of using structural geology to
analyze three-dimensional seismic data we turn to
the Oseberg Syd Field operated by the Norwegian
company Norsk Hydro (Faerseth et al., 1997). The
faulting in two parts of this field, called Omega
North and Omega South (Fig. 1.10), has been investigated using a three-dimensional seismic survey
(Maerten, 2000; Maerten et al., 2000, 2002). The
map depicts the base of the Brent Formation, one
of the hydrocarbon reservoirs. The black stripes of
variable width represent the normal faults that
cut this formation and separate pieces of the Brent
Formation in map view. The major faults in this
field strike approximately north–south and dip to
the west. A second set of faults is less well developed, striking approximately northwest–southeast and dipping to the southwest.
1.3 FAULTING IN A NORTH SEA HYDROCARBON RESERVOIR
13
2 km
Omega North
Well 8
Well 10
Omega South
N
Base of
Brent
Fault
Dip
Dip
separation
Horizontal
separation
Fig 1.10 Map of normal faults in part of the Oseberg Syd
Field in the northern North Sea based on the structural
separation of the base of the Brent Formation. Wells No. 8
and No. 10 penetrate the producing reservoir and data from
these wells suggest the Omega North and Omega South
regions are isolated from one another by sealing faults. The
dashed square indicates the area of faulting investigated by
modeling. Inset: Schematic vertical cross section that
illustrates how the width of the fault stripe on the map (gray
on cross section) depends upon the dip of the normal fault
and the dip separation of a particular horizon. Reprinted
from Maerten et al. (2000) by permission of the AAPG
whose permission is required for future use.