

et al., 1997). For offshore surveys the seismographs
are towed in long strings behind a ship and the
sources for the acoustic waves are implosions
created by submerged devices called air guns. The
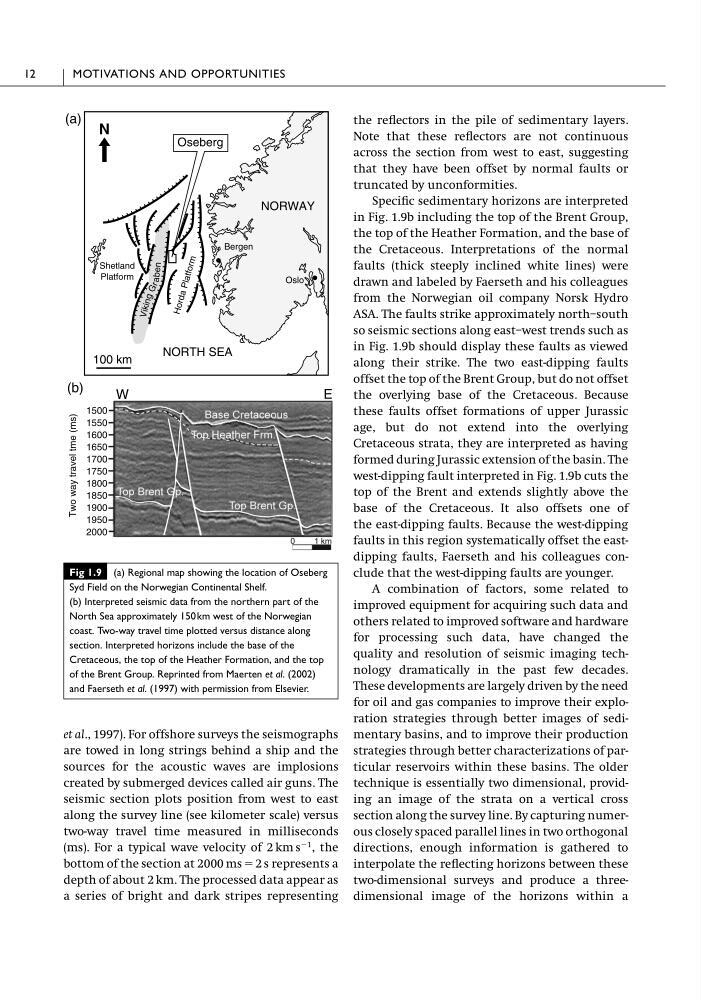
seismic section plots position from west to east
along the survey line (see kilometer scale) versus
two-way travel time measured in milliseconds
(ms). For a typical wave velocity of 2 km s
Ϫ1 , the
bottom of the section at 2000 ms ϭ 2 s represents a
depth of about 2 km. The processed data appear as
a series of bright and dark stripes representing
the reflectors in the pile of sedimentary layers.
Note that these reflectors are not continuous
across the section from west to east, suggesting
that they have been offset by normal faults or
truncated by unconformities.
Specific sedimentary horizons are interpreted
in Fig. 1.9b including the top of the Brent Group,
the top of the Heather Formation, and the base of
the Cretaceous. Interpretations of the normal
faults (thick steeply inclined white lines) were
drawn and labeled by Faerseth and his colleagues
from the Norwegian oil company Norsk Hydro
ASA. The faults strike approximately north–south
so seismic sections along east–west trends such as
in Fig. 1.9b should display these faults as viewed
along their strike. The two east-dipping faults
offset the top of the Brent Group, but do not offset
the overlying base of the Cretaceous. Because
these faults offset formations of upper Jurassic
age, but do not extend into the overlying
Cretaceous strata, they are interpreted as having
formed during Jurassic extension of the basin. The
west-dipping fault interpreted in Fig. 1.9b cuts the
top of the Brent and extends slightly above the
base of the Cretaceous. It also offsets one of
the east-dipping faults. Because the west-dipping
faults in this region systematically offset the eastdipping faults, Faerseth and his colleagues conclude that the west-dipping faults are younger.
A combination of factors, some related to
improved equipment for acquiring such data and
others related to improved software and hardware
for processing such data, have changed the
quality and resolution of seismic imaging technology dramatically in the past few decades.
These developments are largely driven by the need
for oil and gas companies to improve their exploration strategies through better images of sedimentary basins, and to improve their production
strategies through better characterizations of particular reservoirs within these basins. The older
technique is essentially two dimensional, providing an image of the strata on a vertical cross
section along the survey line. By capturing numerous closely spaced parallel lines in two orthogonal
directions, enough information is gathered to
interpolate the reflecting horizons between these
two-dimensional surveys and produce a threedimensional image of the horizons within a
12
MOTIVATIONS AND OPPORTUNITIES
NORWAY
Bergen
Shetland
Platform
NORTH SEA
l l l l l l l l l l l l l l l l l l l
l
l
l
l
l
l l l l l l
l
l
l
l l l l
l
l
l
l
l
l
l
l l
l
l
l
l
l
l
l
l
l
l
l
l
l
l
l
l l l l l
l l l l l
l
l
l
l
l
l
l
l l l l l l l
l l l l l l l l l l l l
l
l
l
l
l
l
l
l
l
l
l
l
l
l
l
l
l
l
l
l
l
l
l
l
l
l
l
l
l
l
l l l
l
l
l
l
l
l
l
l l l
Oslo
V ik in g G r abe n
H or da P la tfo rm
N
100 km
1500
1550
1600
1650
1700
1750
1800
1850
1900
1950
2000
Two way travel tme (ms)
Oseberg
(a)
(b)
W
E
Fig 1.9 (a) Regional map showing the location of Oseberg
Syd Field on the Norwegian Continental Shelf.
(b) Interpreted seismic data from the northern part of the
North Sea approximately 150km west of the Norwegian
coast. Two-way travel time plotted versus distance along
section. Interpreted horizons include the base of the
Cretaceous, the top of the Heather Formation, and the top
of the Brent Group. Reprinted from Maerten et al. (2002)
and Faerseth et al. (1997) with permission from Elsevier.
are towed in long strings behind a ship and the
sources for the acoustic waves are implosions
created by submerged devices called air guns. The
seismic section plots position from west to east
along the survey line (see kilometer scale) versus
two-way travel time measured in milliseconds
(ms). For a typical wave velocity of 2 km s
Ϫ1 , the
bottom of the section at 2000 ms ϭ 2 s represents a
depth of about 2 km. The processed data appear as
a series of bright and dark stripes representing
the reflectors in the pile of sedimentary layers.
Note that these reflectors are not continuous
across the section from west to east, suggesting
that they have been offset by normal faults or
truncated by unconformities.
Specific sedimentary horizons are interpreted
in Fig. 1.9b including the top of the Brent Group,
the top of the Heather Formation, and the base of
the Cretaceous. Interpretations of the normal
faults (thick steeply inclined white lines) were
drawn and labeled by Faerseth and his colleagues
from the Norwegian oil company Norsk Hydro
ASA. The faults strike approximately north–south
so seismic sections along east–west trends such as
in Fig. 1.9b should display these faults as viewed
along their strike. The two east-dipping faults
offset the top of the Brent Group, but do not offset
the overlying base of the Cretaceous. Because
these faults offset formations of upper Jurassic
age, but do not extend into the overlying
Cretaceous strata, they are interpreted as having
formed during Jurassic extension of the basin. The
west-dipping fault interpreted in Fig. 1.9b cuts the
top of the Brent and extends slightly above the
base of the Cretaceous. It also offsets one of
the east-dipping faults. Because the west-dipping
faults in this region systematically offset the eastdipping faults, Faerseth and his colleagues conclude that the west-dipping faults are younger.
A combination of factors, some related to
improved equipment for acquiring such data and
others related to improved software and hardware
for processing such data, have changed the
quality and resolution of seismic imaging technology dramatically in the past few decades.
These developments are largely driven by the need
for oil and gas companies to improve their exploration strategies through better images of sedimentary basins, and to improve their production
strategies through better characterizations of particular reservoirs within these basins. The older
technique is essentially two dimensional, providing an image of the strata on a vertical cross
section along the survey line. By capturing numerous closely spaced parallel lines in two orthogonal
directions, enough information is gathered to
interpolate the reflecting horizons between these
two-dimensional surveys and produce a threedimensional image of the horizons within a
12
MOTIVATIONS AND OPPORTUNITIES
NORWAY
Bergen
Shetland
Platform
NORTH SEA
l l l l l l l l l l l l l l l l l l l
l
l
l
l
l
l l l l l l
l
l
l
l l l l
l
l
l
l
l
l
l
l l
l
l
l
l
l
l
l
l
l
l
l
l
l
l
l
l l l l l
l l l l l
l
l
l
l
l
l
l
l l l l l l l
l l l l l l l l l l l l
l
l
l
l
l
l
l
l
l
l
l
l
l
l
l
l
l
l
l
l
l
l
l
l
l
l
l
l
l
l
l l l
l
l
l
l
l
l
l
l l l
Oslo
V ik in g G r abe n
H or da P la tfo rm
N
100 km
1500
1550
1600
1650
1700
1750
1800
1850
1900
1950
2000
Two way travel tme (ms)
Oseberg
(a)
(b)
W
E
Fig 1.9 (a) Regional map showing the location of Oseberg
Syd Field on the Norwegian Continental Shelf.
(b) Interpreted seismic data from the northern part of the
North Sea approximately 150km west of the Norwegian
coast. Two-way travel time plotted versus distance along
section. Interpreted horizons include the base of the
Cretaceous, the top of the Heather Formation, and the top
of the Brent Group. Reprinted from Maerten et al. (2002)
and Faerseth et al. (1997) with permission from Elsevier.