

adopted because the greatest variation of typical
unit weights is only a factor of two. However, in
some engineering applications, the level of detail
suggested by (6.101) may be prudent (Amadei and
Stephansson, 1997, pp. 41–5).
The following linear relationships summarize
data on the variations in principal stresses with
depths to 2300 m from the Canadian Shield
(Herget, 1993):
(6.102)
Based upon data from Sweden, over the depth
range from 0 to 1000 m, the principal stress magnitudes vary with depth as (Stephansson, 1993):
(6.103)
These best-fitting linear relationships define gradients that range from 0.020 to 0.040 MPa m
Ϫ1 .
The stress magnitudes at the surface (z ϭ 0) range
from approximately 0 to greater than 12 MPa, and
all the principal stresses are compressive over the
range of depths. The conclusion that the state of
stress is anisotropic (different principal stress
magnitudes in different directions) should not
come as a surprise to structural geologists,
because the formation of most geologic structures
requires an anisotropic stress state.
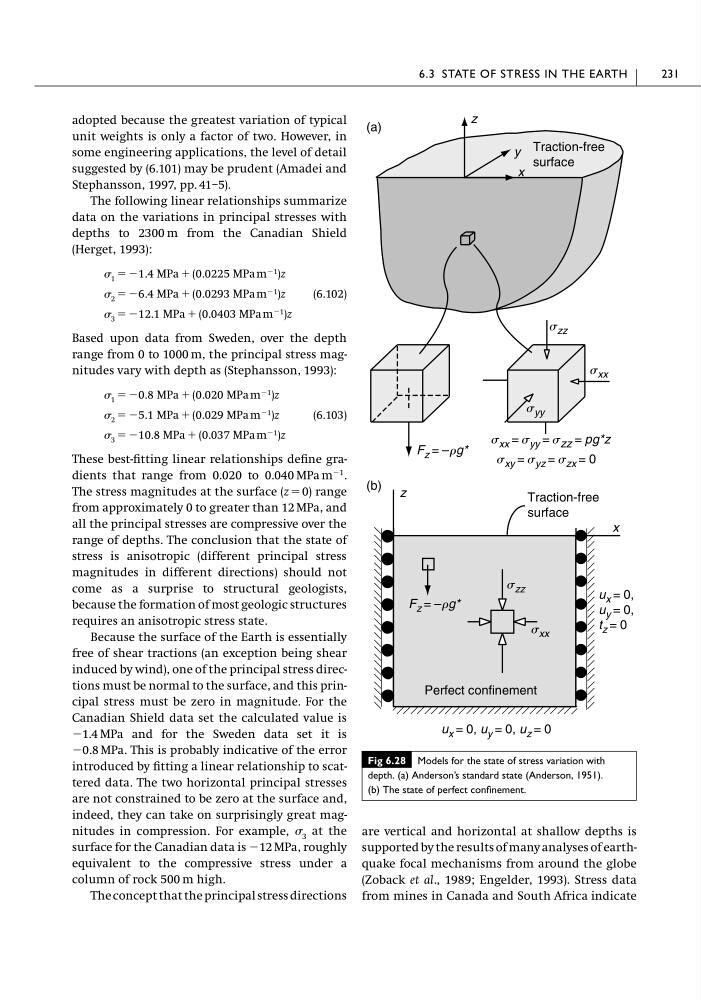
Because the surface of the Earth is essentially
free of shear tractions (an exception being shear
induced by wind), one of the principal stress directions must be normal to the surface, and this principal stress must be zero in magnitude. For the
Canadian Shield data set the calculated value is
Ϫ1.4 MPa and for the Sweden data set it is
Ϫ0.8 MPa. This is probably indicative of the error
introduced by fitting a linear relationship to scattered data. The two horizontal principal stresses
are not constrained to be zero at the surface and,
indeed, they can take on surprisingly great magnitudes in compression. For example, 3 at the
surface for the Canadian data is Ϫ12 MPa, roughly
equivalent to the compressive stress under a
column of rock 500 m high.
The concept that the principal stress directions
3 ϭ Ϫ10.8 MPa ϩ (0.037 MPa m Ϫ1 )z
2 ϭ Ϫ5.1 MPa ϩ (0.029 MPa m Ϫ1 )z
1 ϭ Ϫ0.8 MPa ϩ (0.020 MPa m Ϫ1 )z
3 ϭ Ϫ12.1 MPa ϩ (0.0403 MPa m Ϫ1 )z
2 ϭ Ϫ6.4 MPa ϩ (0.0293 MPa m Ϫ1 )z
1 ϭ Ϫ1.4 MPa ϩ (0.0225 MPa m Ϫ1 )z
are vertical and horizontal at shallow depths is
supported by the results of many analyses of earthquake focal mechanisms from around the globe
(Zoback et al., 1989; Engelder, 1993). Stress data
from mines in Canada and South Africa indicate
6.3 STATE OF STRESS IN THE EARTH
231
Fig 6.28 Models for the state of stress variation with
depth. (a) Anderson’s standard state (Anderson, 1951).
(b) The state of perfect confinement.
x
z
Traction-free
surface
y
x
z
(b)
(a)
u x = 0, u y = 0, u z = 0
s xx
s zz
F z = –rg*
Traction-free
surface
u x = 0,
u y = 0,
t z = 0
s zz
s xx
s yy
F z = –rg*
s xx = s yy = s zz = pg*z
s xy = s yz = s zx = 0
Perfect confinement
unit weights is only a factor of two. However, in
some engineering applications, the level of detail
suggested by (6.101) may be prudent (Amadei and
Stephansson, 1997, pp. 41–5).
The following linear relationships summarize
data on the variations in principal stresses with
depths to 2300 m from the Canadian Shield
(Herget, 1993):
(6.102)
Based upon data from Sweden, over the depth
range from 0 to 1000 m, the principal stress magnitudes vary with depth as (Stephansson, 1993):
(6.103)
These best-fitting linear relationships define gradients that range from 0.020 to 0.040 MPa m
Ϫ1 .
The stress magnitudes at the surface (z ϭ 0) range
from approximately 0 to greater than 12 MPa, and
all the principal stresses are compressive over the
range of depths. The conclusion that the state of
stress is anisotropic (different principal stress
magnitudes in different directions) should not
come as a surprise to structural geologists,
because the formation of most geologic structures
requires an anisotropic stress state.
Because the surface of the Earth is essentially
free of shear tractions (an exception being shear
induced by wind), one of the principal stress directions must be normal to the surface, and this principal stress must be zero in magnitude. For the
Canadian Shield data set the calculated value is
Ϫ1.4 MPa and for the Sweden data set it is
Ϫ0.8 MPa. This is probably indicative of the error
introduced by fitting a linear relationship to scattered data. The two horizontal principal stresses
are not constrained to be zero at the surface and,
indeed, they can take on surprisingly great magnitudes in compression. For example, 3 at the
surface for the Canadian data is Ϫ12 MPa, roughly
equivalent to the compressive stress under a
column of rock 500 m high.
The concept that the principal stress directions
3 ϭ Ϫ10.8 MPa ϩ (0.037 MPa m Ϫ1 )z
2 ϭ Ϫ5.1 MPa ϩ (0.029 MPa m Ϫ1 )z
1 ϭ Ϫ0.8 MPa ϩ (0.020 MPa m Ϫ1 )z
3 ϭ Ϫ12.1 MPa ϩ (0.0403 MPa m Ϫ1 )z
2 ϭ Ϫ6.4 MPa ϩ (0.0293 MPa m Ϫ1 )z
1 ϭ Ϫ1.4 MPa ϩ (0.0225 MPa m Ϫ1 )z
are vertical and horizontal at shallow depths is
supported by the results of many analyses of earthquake focal mechanisms from around the globe
(Zoback et al., 1989; Engelder, 1993). Stress data
from mines in Canada and South Africa indicate
6.3 STATE OF STRESS IN THE EARTH
231
Fig 6.28 Models for the state of stress variation with
depth. (a) Anderson’s standard state (Anderson, 1951).
(b) The state of perfect confinement.
x
z
Traction-free
surface
y
x
z
(b)
(a)
u x = 0, u y = 0, u z = 0
s xx
s zz
F z = –rg*
Traction-free
surface
u x = 0,
u y = 0,
t z = 0
s zz
s xx
s yy
F z = –rg*
s xx = s yy = s zz = pg*z
s xy = s yz = s zx = 0
Perfect confinement