

reservoirs imposes sufficient traction to depress
the surface over a broad region. The weight of the
atmosphere provides a normal traction (1 atmϭ
0.1 MPa) and the wind imposes some shear traction, but all of these tractions acting on Earth’s
surface usually are ignored because the tractions
involved in the tectonic processes leading to the
development of geological structures are significantly greater in magnitude.
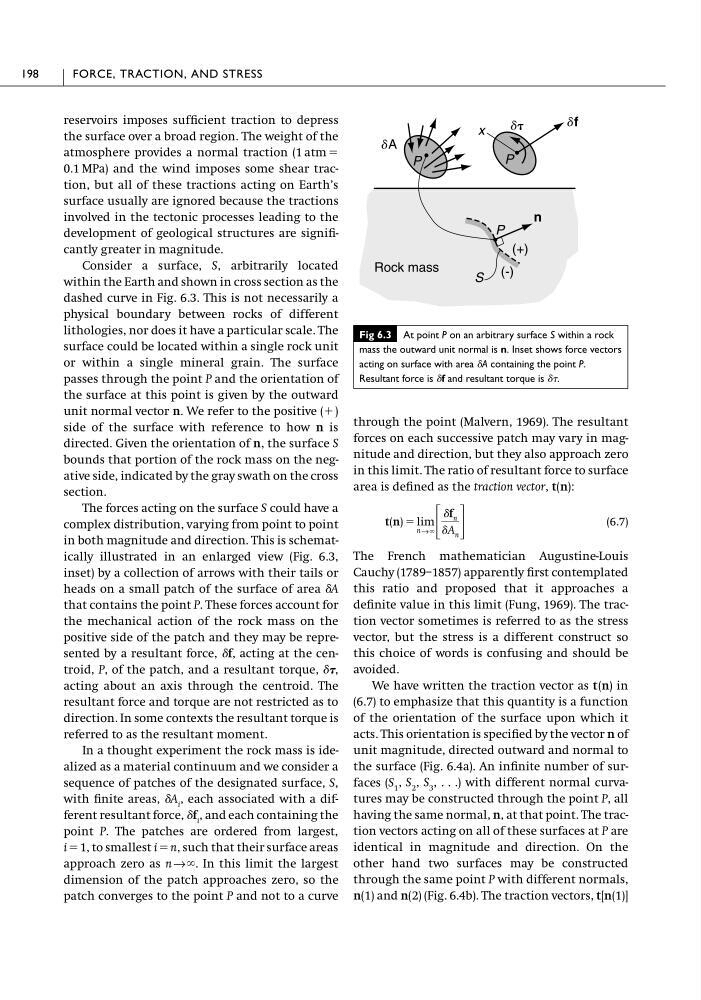
Consider a surface, S, arbitrarily located
within the Earth and shown in cross section as the
dashed curve in Fig. 6.3. This is not necessarily a
physical boundary between rocks of different
lithologies, nor does it have a particular scale. The
surface could be located within a single rock unit
or within a single mineral grain. The surface
passes through the point P and the orientation of
the surface at this point is given by the outward
unit normal vector n. We refer to the positive (ϩ )
side of the surface with reference to how n is
directed. Given the orientation of n, the surface S
bounds that portion of the rock mass on the negative side, indicated by the gray swath on the cross
section.
The forces acting on the surface S could have a
complex distribution, varying from point to point
in both magnitude and direction. This is schematically illustrated in an enlarged view (Fig. 6.3,
inset) by a collection of arrows with their tails or
heads on a small patch of the surface of area ␦A
that contains the point P. These forces account for
the mechanical action of the rock mass on the
positive side of the patch and they may be represented by a resultant force, ␦f, acting at the centroid, P, of the patch, and a resultant torque, ␦,
acting about an axis through the centroid. The
resultant force and torque are not restricted as to
direction. In some contexts the resultant torque is
referred to as the resultant moment.
In a thought experiment the rock mass is idealized as a material continuum and we consider a
sequence of patches of the designated surface, S,
with finite areas, ␦A i , each associated with a different resultant force, ␦f i , and each containing the
point P. The patches are ordered from largest,
i ϭ 1, to smallest i ϭ n, such that their surface areas
approach zero as n → ϱ. In this limit the largest
dimension of the patch approaches zero, so the
patch converges to the point P and not to a curve
through the point (Malvern, 1969). The resultant
forces on each successive patch may vary in magnitude and direction, but they also approach zero
in this limit. The ratio of resultant force to surface
area is defined as the traction vector, t(n):
(6.7)
The French mathematician Augustine-Louis
Cauchy (1789–1857) apparently first contemplated
this ratio and proposed that it approaches a
definite value in this limit (Fung, 1969). The traction vector sometimes is referred to as the stress
vector, but the stress is a different construct so
this choice of words is confusing and should be
avoided.
We have written the traction vector as t(n) in
(6.7) to emphasize that this quantity is a function
of the orientation of the surface upon which it
acts. This orientation is specified by the vector n of
unit magnitude, directed outward and normal to
the surface (Fig. 6.4a). An infinite number of surfaces (S 1 , S 2 , S 3 , . . .) with different normal curvatures may be constructed through the point P, all
having the same normal, n, at that point. The traction vectors acting on all of these surfaces at P are
identical in magnitude and direction. On the
other hand two surfaces may be constructed
through the same point P with different normals,
n(1) and n(2) (Fig. 6.4b). The traction vectors, t[n(1)]
t(n) ϭ lim
n→ϱ ΄
␦f n
␦A n ΅
198
FORCE, TRACTION, AND STRESS
Fig 6.3 At point P on an arbitrary surface S within a rock
mass the outward unit normal is n. Inset shows force vectors
acting on surface with area ␦A containing the point P.
Resultant force is ␦f and resultant torque is ␦.
P
d
df
dA
S
P
Rock mass
n
P
(+)
(-)
x
the surface over a broad region. The weight of the
atmosphere provides a normal traction (1 atmϭ
0.1 MPa) and the wind imposes some shear traction, but all of these tractions acting on Earth’s
surface usually are ignored because the tractions
involved in the tectonic processes leading to the
development of geological structures are significantly greater in magnitude.
Consider a surface, S, arbitrarily located
within the Earth and shown in cross section as the
dashed curve in Fig. 6.3. This is not necessarily a
physical boundary between rocks of different
lithologies, nor does it have a particular scale. The
surface could be located within a single rock unit
or within a single mineral grain. The surface
passes through the point P and the orientation of
the surface at this point is given by the outward
unit normal vector n. We refer to the positive (ϩ )
side of the surface with reference to how n is
directed. Given the orientation of n, the surface S
bounds that portion of the rock mass on the negative side, indicated by the gray swath on the cross
section.
The forces acting on the surface S could have a
complex distribution, varying from point to point
in both magnitude and direction. This is schematically illustrated in an enlarged view (Fig. 6.3,
inset) by a collection of arrows with their tails or
heads on a small patch of the surface of area ␦A
that contains the point P. These forces account for
the mechanical action of the rock mass on the
positive side of the patch and they may be represented by a resultant force, ␦f, acting at the centroid, P, of the patch, and a resultant torque, ␦,
acting about an axis through the centroid. The
resultant force and torque are not restricted as to
direction. In some contexts the resultant torque is
referred to as the resultant moment.
In a thought experiment the rock mass is idealized as a material continuum and we consider a
sequence of patches of the designated surface, S,
with finite areas, ␦A i , each associated with a different resultant force, ␦f i , and each containing the
point P. The patches are ordered from largest,
i ϭ 1, to smallest i ϭ n, such that their surface areas
approach zero as n → ϱ. In this limit the largest
dimension of the patch approaches zero, so the
patch converges to the point P and not to a curve
through the point (Malvern, 1969). The resultant
forces on each successive patch may vary in magnitude and direction, but they also approach zero
in this limit. The ratio of resultant force to surface
area is defined as the traction vector, t(n):
(6.7)
The French mathematician Augustine-Louis
Cauchy (1789–1857) apparently first contemplated
this ratio and proposed that it approaches a
definite value in this limit (Fung, 1969). The traction vector sometimes is referred to as the stress
vector, but the stress is a different construct so
this choice of words is confusing and should be
avoided.
We have written the traction vector as t(n) in
(6.7) to emphasize that this quantity is a function
of the orientation of the surface upon which it
acts. This orientation is specified by the vector n of
unit magnitude, directed outward and normal to
the surface (Fig. 6.4a). An infinite number of surfaces (S 1 , S 2 , S 3 , . . .) with different normal curvatures may be constructed through the point P, all
having the same normal, n, at that point. The traction vectors acting on all of these surfaces at P are
identical in magnitude and direction. On the
other hand two surfaces may be constructed
through the same point P with different normals,
n(1) and n(2) (Fig. 6.4b). The traction vectors, t[n(1)]
t(n) ϭ lim
n→ϱ ΄
␦f n
␦A n ΅
198
FORCE, TRACTION, AND STRESS
Fig 6.3 At point P on an arbitrary surface S within a rock
mass the outward unit normal is n. Inset shows force vectors
acting on surface with area ␦A containing the point P.
Resultant force is ␦f and resultant torque is ␦.
P
d
df
dA
S
P
Rock mass
n
P
(+)
(-)
x