

In contrast the errors associated with the less
deformed sample are 7% and Ϫ4%, respectively.
Whether or not these errors are tolerable depends
upon the magnitude of errors associated with
data collection and the application of the analysis.
As a second example consider the displacement field associated with faulting during the
great San Francisco earthquake of 1906 along the
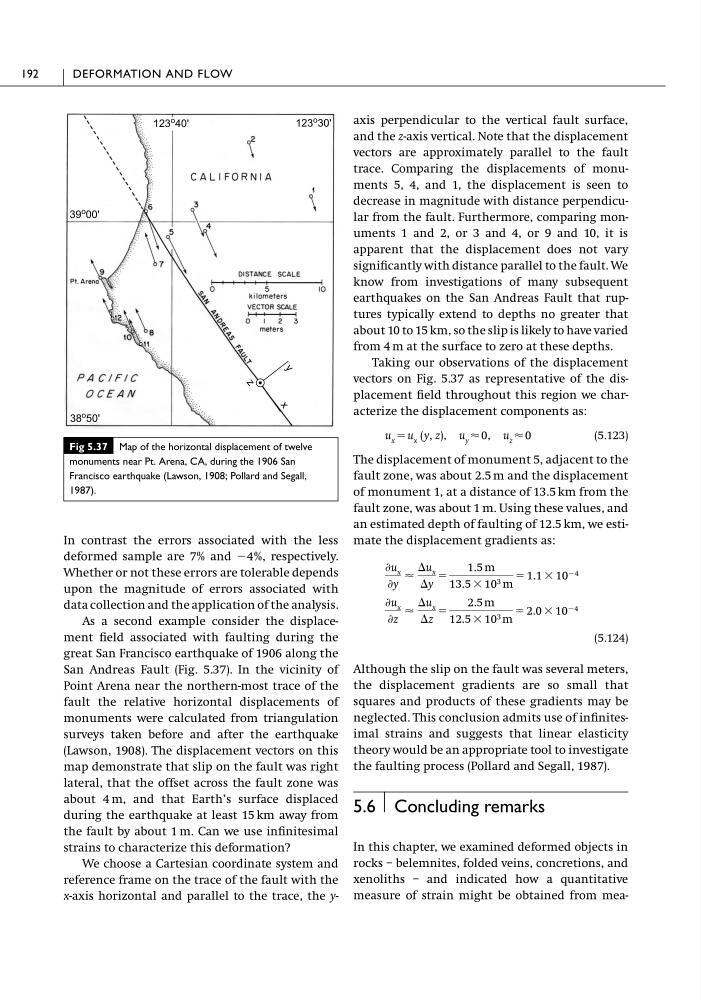
San Andreas Fault (Fig. 5.37). In the vicinity of
Point Arena near the northern-most trace of the
fault the relative horizontal displacements of
monuments were calculated from triangulation
surveys taken before and after the earthquake
(Lawson, 1908). The displacement vectors on this
map demonstrate that slip on the fault was right
lateral, that the offset across the fault zone was
about 4 m, and that Earth’s surface displaced
during the earthquake at least 15 km away from
the fault by about 1 m. Can we use infinitesimal
strains to characterize this deformation?
We choose a Cartesian coordinate system and
reference frame on the trace of the fault with the
x-axis horizontal and parallel to the trace, the yaxis perpendicular to the vertical fault surface,
and the z-axis vertical. Note that the displacement
vectors are approximately parallel to the fault
trace. Comparing the displacements of monuments 5, 4, and 1, the displacement is seen to
decrease in magnitude with distance perpendicular from the fault. Furthermore, comparing monuments 1 and 2, or 3 and 4, or 9 and 10, it is
apparent that the displacement does not vary
significantly with distance parallel to the fault. We
know from investigations of many subsequent
earthquakes on the San Andreas Fault that ruptures typically extend to depths no greater that
about 10 to 15 km, so the slip is likely to have varied
from 4 m at the surface to zero at these depths.
Taking our observations of the displacement
vectors on Fig. 5.37 as representative of the displacement field throughout this region we characterize the displacement components as:
u x ϭ u x (y, z), u y Ϸ 0, u z Ϸ 0
(5.123)
The displacement of monument 5, adjacent to the
fault zone, was about 2.5 m and the displacement
of monument 1, at a distance of 13.5 km from the
fault zone, was about 1 m. Using these values, and
an estimated depth of faulting of 12.5 km, we estimate the displacement gradients as:
(5.124)
Although the slip on the fault was several meters,
the displacement gradients are so small that
squares and products of these gradients may be
neglected. This conclusion admits use of infinitesimal strains and suggests that linear elasticity
theory would be an appropriate tool to investigate
the faulting process (Pollard and Segall, 1987).
5.6 Concluding remarks
In this chapter, we examined deformed objects in
rocks – belemnites, folded veins, concretions, and
xenoliths – and indicated how a quantitative
measure of strain might be obtained from meaѨu x
Ѩz
Ϸ
⌬u x
⌬z
ϭ
2.5 m
12.5 ϫ 10 3 m
ϭ 2.0 ϫ 10 Ϫ4
Ѩu x
Ѩy
Ϸ
⌬u x
⌬y
ϭ
1.5 m
13.5 ϫ 10 3 m
ϭ 1.1 ϫ 10 Ϫ4
192
DEFORMATION AND FLOW
Fig 5.37 Map of the horizontal displacement of twelve
monuments near Pt. Arena, CA, during the 1906 San
Francisco earthquake (Lawson, 1908; Pollard and Segall,
1987).
123
o 40'
123
o 30'
39 o 00'
38 o 50'
x y
z
deformed sample are 7% and Ϫ4%, respectively.
Whether or not these errors are tolerable depends
upon the magnitude of errors associated with
data collection and the application of the analysis.
As a second example consider the displacement field associated with faulting during the
great San Francisco earthquake of 1906 along the
San Andreas Fault (Fig. 5.37). In the vicinity of
Point Arena near the northern-most trace of the
fault the relative horizontal displacements of
monuments were calculated from triangulation
surveys taken before and after the earthquake
(Lawson, 1908). The displacement vectors on this
map demonstrate that slip on the fault was right
lateral, that the offset across the fault zone was
about 4 m, and that Earth’s surface displaced
during the earthquake at least 15 km away from
the fault by about 1 m. Can we use infinitesimal
strains to characterize this deformation?
We choose a Cartesian coordinate system and
reference frame on the trace of the fault with the
x-axis horizontal and parallel to the trace, the yaxis perpendicular to the vertical fault surface,
and the z-axis vertical. Note that the displacement
vectors are approximately parallel to the fault
trace. Comparing the displacements of monuments 5, 4, and 1, the displacement is seen to
decrease in magnitude with distance perpendicular from the fault. Furthermore, comparing monuments 1 and 2, or 3 and 4, or 9 and 10, it is
apparent that the displacement does not vary
significantly with distance parallel to the fault. We
know from investigations of many subsequent
earthquakes on the San Andreas Fault that ruptures typically extend to depths no greater that
about 10 to 15 km, so the slip is likely to have varied
from 4 m at the surface to zero at these depths.
Taking our observations of the displacement
vectors on Fig. 5.37 as representative of the displacement field throughout this region we characterize the displacement components as:
u x ϭ u x (y, z), u y Ϸ 0, u z Ϸ 0
(5.123)
The displacement of monument 5, adjacent to the
fault zone, was about 2.5 m and the displacement
of monument 1, at a distance of 13.5 km from the
fault zone, was about 1 m. Using these values, and
an estimated depth of faulting of 12.5 km, we estimate the displacement gradients as:
(5.124)
Although the slip on the fault was several meters,
the displacement gradients are so small that
squares and products of these gradients may be
neglected. This conclusion admits use of infinitesimal strains and suggests that linear elasticity
theory would be an appropriate tool to investigate
the faulting process (Pollard and Segall, 1987).
5.6 Concluding remarks
In this chapter, we examined deformed objects in
rocks – belemnites, folded veins, concretions, and
xenoliths – and indicated how a quantitative
measure of strain might be obtained from meaѨu x
Ѩz
Ϸ
⌬u x
⌬z
ϭ
2.5 m
12.5 ϫ 10 3 m
ϭ 2.0 ϫ 10 Ϫ4
Ѩu x
Ѩy
Ϸ
⌬u x
⌬y
ϭ
1.5 m
13.5 ϫ 10 3 m
ϭ 1.1 ϫ 10 Ϫ4
192
DEFORMATION AND FLOW
Fig 5.37 Map of the horizontal displacement of twelve
monuments near Pt. Arena, CA, during the 1906 San
Francisco earthquake (Lawson, 1908; Pollard and Segall,
1987).
123
o 40'
123
o 30'
39 o 00'
38 o 50'
x y
z