

above, T r ϭ 3.1 ϫ 10
Ϫ11 , one model second is one
thousand prototype years. At the beginning (0 s)
and at the ending (1000 s) of the process, the
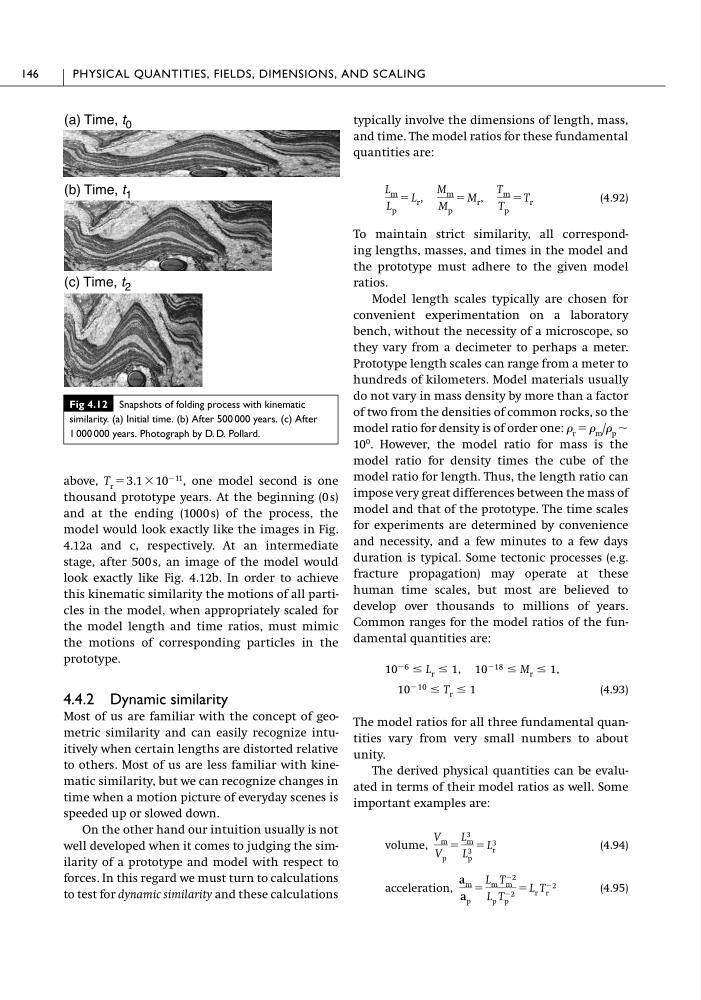
model would look exactly like the images in Fig.
4.12a and c, respectively. At an intermediate
stage, after 500 s, an image of the model would
look exactly like Fig. 4.12b. In order to achieve
this kinematic similarity the motions of all particles in the model, when appropriately scaled for
the model length and time ratios, must mimic
the motions of corresponding particles in the
prototype.
4.4.2 Dynamic similarity
Most of us are familiar with the concept of geometric similarity and can easily recognize intuitively when certain lengths are distorted relative
to others. Most of us are less familiar with kinematic similarity, but we can recognize changes in
time when a motion picture of everyday scenes is
speeded up or slowed down.
On the other hand our intuition usually is not
well developed when it comes to judging the similarity of a prototype and model with respect to
forces. In this regard we must turn to calculations
to test for dynamic similarity and these calculations
typically involve the dimensions of length, mass,
and time. The model ratios for these fundamental
quantities are:
(4.92)
To maintain strict similarity, all corresponding lengths, masses, and times in the model and
the prototype must adhere to the given model
ratios.
Model length scales typically are chosen for
convenient experimentation on a laboratory
bench, without the necessity of a microscope, so
they vary from a decimeter to perhaps a meter.
Prototype length scales can range from a meter to
hundreds of kilometers. Model materials usually
do not vary in mass density by more than a factor
of two from the densities of common rocks, so the
model ratio for density is of order one: r ϭ m / p ϳ
10
0 . However, the model ratio for mass is the
model ratio for density times the cube of the
model ratio for length. Thus, the length ratio can
impose very great differences between the mass of
model and that of the prototype. The time scales
for experiments are determined by convenience
and necessity, and a few minutes to a few days
duration is typical. Some tectonic processes (e.g.
fracture propagation) may operate at these
human time scales, but most are believed to
develop over thousands to millions of years.
Common ranges for the model ratios of the fundamental quantities are:
(4.93)
The model ratios for all three fundamental quantities vary from very small numbers to about
unity.
The derived physical quantities can be evaluated in terms of their model ratios as well. Some
important examples are:
(4.94)
(4.95)
acceleration,
a m
a p
ϭ
L m T Ϫ2
m
L p T Ϫ2
p
ϭ L r T Ϫ2
r
volume,
V m
V p
ϭ
L 3
m
L 3
p
ϭ L 3
r
10 Ϫ10 Յ T r Յ 1
10 Ϫ6 Յ L r Յ 1, 10 Ϫ18 Յ M r Յ 1,
L m
L p
ϭ L r ,
M m
M p
ϭ M r ,
T m
T p
ϭ T r
146
PHYSICAL QUANTITIES, FIELDS, DIMENSIONS, AND SCALING
Fig 4.12 Snapshots of folding process with kinematic
similarity. (a) Initial time. (b) After 500 000 years. (c) After
1 000 000 years. Photograph by D. D. Pollard.
(c) Time, t 2
(b) Time, t 1
(a) Time, t 0
Ϫ11 , one model second is one
thousand prototype years. At the beginning (0 s)
and at the ending (1000 s) of the process, the
model would look exactly like the images in Fig.
4.12a and c, respectively. At an intermediate
stage, after 500 s, an image of the model would
look exactly like Fig. 4.12b. In order to achieve
this kinematic similarity the motions of all particles in the model, when appropriately scaled for
the model length and time ratios, must mimic
the motions of corresponding particles in the
prototype.
4.4.2 Dynamic similarity
Most of us are familiar with the concept of geometric similarity and can easily recognize intuitively when certain lengths are distorted relative
to others. Most of us are less familiar with kinematic similarity, but we can recognize changes in
time when a motion picture of everyday scenes is
speeded up or slowed down.
On the other hand our intuition usually is not
well developed when it comes to judging the similarity of a prototype and model with respect to
forces. In this regard we must turn to calculations
to test for dynamic similarity and these calculations
typically involve the dimensions of length, mass,
and time. The model ratios for these fundamental
quantities are:
(4.92)
To maintain strict similarity, all corresponding lengths, masses, and times in the model and
the prototype must adhere to the given model
ratios.
Model length scales typically are chosen for
convenient experimentation on a laboratory
bench, without the necessity of a microscope, so
they vary from a decimeter to perhaps a meter.
Prototype length scales can range from a meter to
hundreds of kilometers. Model materials usually
do not vary in mass density by more than a factor
of two from the densities of common rocks, so the
model ratio for density is of order one: r ϭ m / p ϳ
10
0 . However, the model ratio for mass is the
model ratio for density times the cube of the
model ratio for length. Thus, the length ratio can
impose very great differences between the mass of
model and that of the prototype. The time scales
for experiments are determined by convenience
and necessity, and a few minutes to a few days
duration is typical. Some tectonic processes (e.g.
fracture propagation) may operate at these
human time scales, but most are believed to
develop over thousands to millions of years.
Common ranges for the model ratios of the fundamental quantities are:
(4.93)
The model ratios for all three fundamental quantities vary from very small numbers to about
unity.
The derived physical quantities can be evaluated in terms of their model ratios as well. Some
important examples are:
(4.94)
(4.95)
acceleration,
a m
a p
ϭ
L m T Ϫ2
m
L p T Ϫ2
p
ϭ L r T Ϫ2
r
volume,
V m
V p
ϭ
L 3
m
L 3
p
ϭ L 3
r
10 Ϫ10 Յ T r Յ 1
10 Ϫ6 Յ L r Յ 1, 10 Ϫ18 Յ M r Յ 1,
L m
L p
ϭ L r ,
M m
M p
ϭ M r ,
T m
T p
ϭ T r
146
PHYSICAL QUANTITIES, FIELDS, DIMENSIONS, AND SCALING
Fig 4.12 Snapshots of folding process with kinematic
similarity. (a) Initial time. (b) After 500 000 years. (c) After
1 000 000 years. Photograph by D. D. Pollard.
(c) Time, t 2
(b) Time, t 1
(a) Time, t 0