

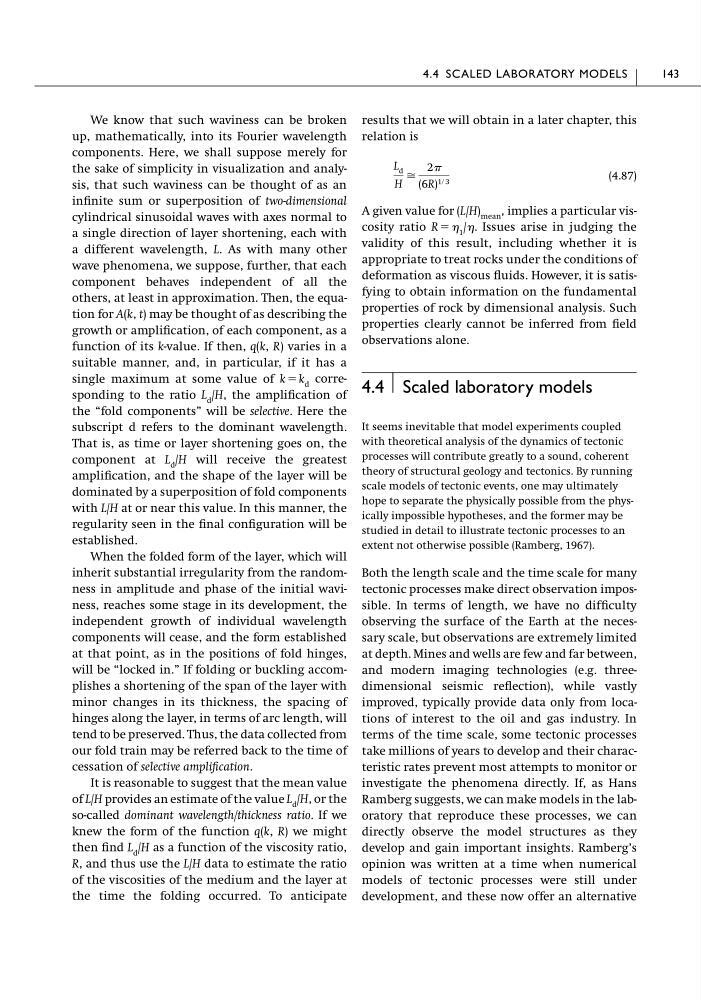
We know that such waviness can be broken
up, mathematically, into its Fourier wavelength
components. Here, we shall suppose merely for
the sake of simplicity in visualization and analysis, that such waviness can be thought of as an
infinite sum or superposition of two-dimensional
cylindrical sinusoidal waves with axes normal to
a single direction of layer shortening, each with
a different wavelength, L. As with many other
wave phenomena, we suppose, further, that each
component behaves independent of all the
others, at least in approximation. Then, the equation for A(k, t) may be thought of as describing the
growth or amplification, of each component, as a
function of its k-value. If then, q(k, R) varies in a
suitable manner, and, in particular, if it has a
single maximum at some value of k ϭ k d corresponding to the ratio L d /H, the amplification of
the “fold components” will be selective. Here the
subscript d refers to the dominant wavelength.
That is, as time or layer shortening goes on, the
component at L d /H will receive the greatest
amplification, and the shape of the layer will be
dominated by a superposition of fold components
with L/H at or near this value. In this manner, the
regularity seen in the final configuration will be
established.
When the folded form of the layer, which will
inherit substantial irregularity from the randomness in amplitude and phase of the initial waviness, reaches some stage in its development, the
independent growth of individual wavelength
components will cease, and the form established
at that point, as in the positions of fold hinges,
will be “locked in.” If folding or buckling accomplishes a shortening of the span of the layer with
minor changes in its thickness, the spacing of
hinges along the layer, in terms of arc length, will
tend to be preserved. Thus, the data collected from
our fold train may be referred back to the time of
cessation of selective amplification.
It is reasonable to suggest that the mean value
of L/H provides an estimate of the value L d /H, or the
so-called dominant wavelength/thickness ratio. If we
knew the form of the function q(k, R) we might
then find L d /H as a function of the viscosity ratio,
R, and thus use the L/H data to estimate the ratio
of the viscosities of the medium and the layer at
the time the folding occurred. To anticipate
results that we will obtain in a later chapter, this
relation is
(4.87)
A given value for (L/H) mean , implies a particular viscosity ratio R ϭ 1 /. Issues arise in judging the
validity of this result, including whether it is
appropriate to treat rocks under the conditions of
deformation as viscous fluids. However, it is satisfying to obtain information on the fundamental
properties of rock by dimensional analysis. Such
properties clearly cannot be inferred from field
observations alone.
4.4 Scaled laboratory models
It seems inevitable that model experiments coupled
with theoretical analysis of the dynamics of tectonic
processes will contribute greatly to a sound, coherent
theory of structural geology and tectonics. By running
scale models of tectonic events, one may ultimately
hope to separate the physically possible from the physically impossible hypotheses, and the former may be
studied in detail to illustrate tectonic processes to an
extent not otherwise possible (Ramberg, 1967).
Both the length scale and the time scale for many
tectonic processes make direct observation impossible. In terms of length, we have no difficulty
observing the surface of the Earth at the necessary scale, but observations are extremely limited
at depth. Mines and wells are few and far between,
and modern imaging technologies (e.g. threedimensional seismic reflection), while vastly
improved, typically provide data only from locations of interest to the oil and gas industry. In
terms of the time scale, some tectonic processes
take millions of years to develop and their characteristic rates prevent most attempts to monitor or
investigate the phenomena directly. If, as Hans
Ramberg suggests, we can make models in the laboratory that reproduce these processes, we can
directly observe the model structures as they
develop and gain important insights. Ramberg’s
opinion was written at a time when numerical
models of tectonic processes were still under
development, and these now offer an alternative
L d
H
ഡ
2
(6R) 1ր 3
4.4 SCALED LABORATORY MODELS
143
up, mathematically, into its Fourier wavelength
components. Here, we shall suppose merely for
the sake of simplicity in visualization and analysis, that such waviness can be thought of as an
infinite sum or superposition of two-dimensional
cylindrical sinusoidal waves with axes normal to
a single direction of layer shortening, each with
a different wavelength, L. As with many other
wave phenomena, we suppose, further, that each
component behaves independent of all the
others, at least in approximation. Then, the equation for A(k, t) may be thought of as describing the
growth or amplification, of each component, as a
function of its k-value. If then, q(k, R) varies in a
suitable manner, and, in particular, if it has a
single maximum at some value of k ϭ k d corresponding to the ratio L d /H, the amplification of
the “fold components” will be selective. Here the
subscript d refers to the dominant wavelength.
That is, as time or layer shortening goes on, the
component at L d /H will receive the greatest
amplification, and the shape of the layer will be
dominated by a superposition of fold components
with L/H at or near this value. In this manner, the
regularity seen in the final configuration will be
established.
When the folded form of the layer, which will
inherit substantial irregularity from the randomness in amplitude and phase of the initial waviness, reaches some stage in its development, the
independent growth of individual wavelength
components will cease, and the form established
at that point, as in the positions of fold hinges,
will be “locked in.” If folding or buckling accomplishes a shortening of the span of the layer with
minor changes in its thickness, the spacing of
hinges along the layer, in terms of arc length, will
tend to be preserved. Thus, the data collected from
our fold train may be referred back to the time of
cessation of selective amplification.
It is reasonable to suggest that the mean value
of L/H provides an estimate of the value L d /H, or the
so-called dominant wavelength/thickness ratio. If we
knew the form of the function q(k, R) we might
then find L d /H as a function of the viscosity ratio,
R, and thus use the L/H data to estimate the ratio
of the viscosities of the medium and the layer at
the time the folding occurred. To anticipate
results that we will obtain in a later chapter, this
relation is
(4.87)
A given value for (L/H) mean , implies a particular viscosity ratio R ϭ 1 /. Issues arise in judging the
validity of this result, including whether it is
appropriate to treat rocks under the conditions of
deformation as viscous fluids. However, it is satisfying to obtain information on the fundamental
properties of rock by dimensional analysis. Such
properties clearly cannot be inferred from field
observations alone.
4.4 Scaled laboratory models
It seems inevitable that model experiments coupled
with theoretical analysis of the dynamics of tectonic
processes will contribute greatly to a sound, coherent
theory of structural geology and tectonics. By running
scale models of tectonic events, one may ultimately
hope to separate the physically possible from the physically impossible hypotheses, and the former may be
studied in detail to illustrate tectonic processes to an
extent not otherwise possible (Ramberg, 1967).
Both the length scale and the time scale for many
tectonic processes make direct observation impossible. In terms of length, we have no difficulty
observing the surface of the Earth at the necessary scale, but observations are extremely limited
at depth. Mines and wells are few and far between,
and modern imaging technologies (e.g. threedimensional seismic reflection), while vastly
improved, typically provide data only from locations of interest to the oil and gas industry. In
terms of the time scale, some tectonic processes
take millions of years to develop and their characteristic rates prevent most attempts to monitor or
investigate the phenomena directly. If, as Hans
Ramberg suggests, we can make models in the laboratory that reproduce these processes, we can
directly observe the model structures as they
develop and gain important insights. Ramberg’s
opinion was written at a time when numerical
models of tectonic processes were still under
development, and these now offer an alternative
L d
H
ഡ
2
(6R) 1ր 3
4.4 SCALED LABORATORY MODELS
143