

that is approximately cylindrical in shape and
exhibits a smoothly rounded hinge region. Gentle
surface undulations, which trend obliquely to the
hinge line, are superimposed on the more or less
cylindrical shape. Apart from these gentle undulations, the limbs of the modeled surface are
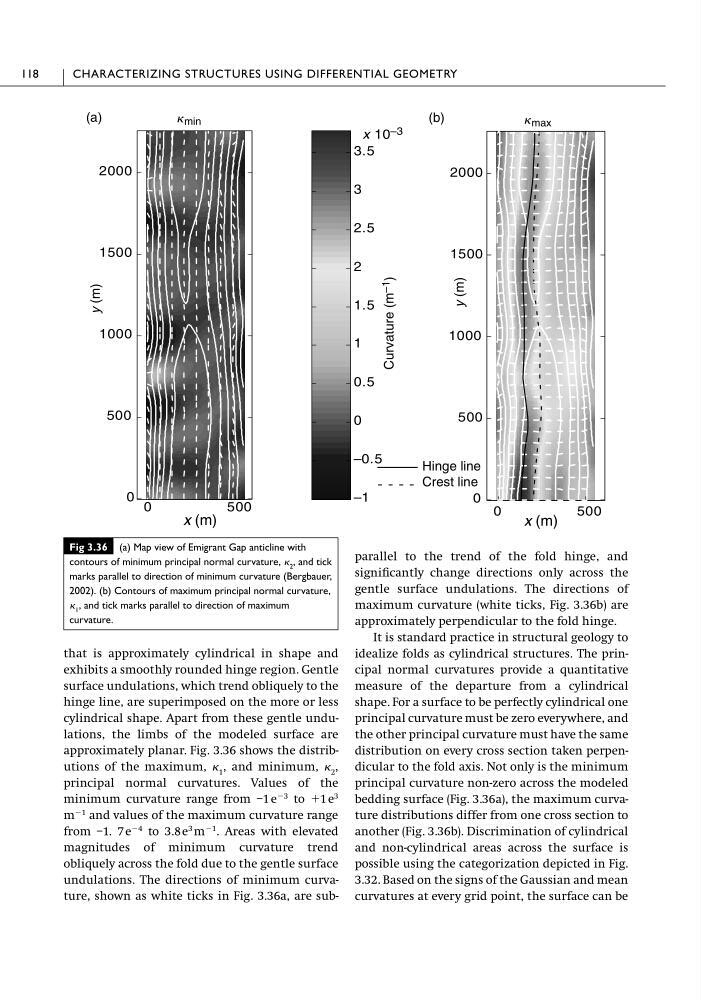
approximately planar. Fig. 3.36 shows the distributions of the maximum, 1 , and minimum, 2 ,
principal normal curvatures. Values of the
minimum curvature range from –1 e
Ϫ3 to ϩ1e
3
m
Ϫ1 and values of the maximum curvature range
from –1. 7 e
Ϫ4 to 3.8 e
3 m
Ϫ1 . Areas with elevated
magnitudes of minimum curvature trend
obliquely across the fold due to the gentle surface
undulations. The directions of minimum curvature, shown as white ticks in Fig. 3.36a, are subparallel to the trend of the fold hinge, and
significantly change directions only across the
gentle surface undulations. The directions of
maximum curvature (white ticks, Fig. 3.36b) are
approximately perpendicular to the fold hinge.
It is standard practice in structural geology to
idealize folds as cylindrical structures. The principal normal curvatures provide a quantitative
measure of the departure from a cylindrical
shape. For a surface to be perfectly cylindrical one
principal curvature must be zero everywhere, and
the other principal curvature must have the same
distribution on every cross section taken perpendicular to the fold axis. Not only is the minimum
principal curvature non-zero across the modeled
bedding surface (Fig. 3.36a), the maximum curvature distributions differ from one cross section to
another (Fig. 3.36b). Discrimination of cylindrical
and non-cylindrical areas across the surface is
possible using the categorization depicted in Fig.
3.32. Based on the signs of the Gaussian and mean
curvatures at every grid point, the surface can be
118
CHARACTERIZING STRUCTURES USING DIFFERENTIAL GEOMETRY
Fig 3.36 (a) Map view of Emigrant Gap anticline with
contours of minimum principal normal curvature, 2 , and tick
marks parallel to direction of minimum curvature (Bergbauer,
2002). (b) Contours of maximum principal normal curvature,
1 , and tick marks parallel to direction of maximum
curvature.
–1
–0.5
0
0.5
1
1.5
2
2.5
3
3.5
x 10 –3
0
500
0
500
1000
1500
2000
0
500
0
500
1000
1500
2000
x (m)
y (m)
Curvature (m –1
)
x (m)
k max
(a)
(b)
k min
Hinge line
Crest line
y (m)
exhibits a smoothly rounded hinge region. Gentle
surface undulations, which trend obliquely to the
hinge line, are superimposed on the more or less
cylindrical shape. Apart from these gentle undulations, the limbs of the modeled surface are
approximately planar. Fig. 3.36 shows the distributions of the maximum, 1 , and minimum, 2 ,
principal normal curvatures. Values of the
minimum curvature range from –1 e
Ϫ3 to ϩ1e
3
m
Ϫ1 and values of the maximum curvature range
from –1. 7 e
Ϫ4 to 3.8 e
3 m
Ϫ1 . Areas with elevated
magnitudes of minimum curvature trend
obliquely across the fold due to the gentle surface
undulations. The directions of minimum curvature, shown as white ticks in Fig. 3.36a, are subparallel to the trend of the fold hinge, and
significantly change directions only across the
gentle surface undulations. The directions of
maximum curvature (white ticks, Fig. 3.36b) are
approximately perpendicular to the fold hinge.
It is standard practice in structural geology to
idealize folds as cylindrical structures. The principal normal curvatures provide a quantitative
measure of the departure from a cylindrical
shape. For a surface to be perfectly cylindrical one
principal curvature must be zero everywhere, and
the other principal curvature must have the same
distribution on every cross section taken perpendicular to the fold axis. Not only is the minimum
principal curvature non-zero across the modeled
bedding surface (Fig. 3.36a), the maximum curvature distributions differ from one cross section to
another (Fig. 3.36b). Discrimination of cylindrical
and non-cylindrical areas across the surface is
possible using the categorization depicted in Fig.
3.32. Based on the signs of the Gaussian and mean
curvatures at every grid point, the surface can be
118
CHARACTERIZING STRUCTURES USING DIFFERENTIAL GEOMETRY
Fig 3.36 (a) Map view of Emigrant Gap anticline with
contours of minimum principal normal curvature, 2 , and tick
marks parallel to direction of minimum curvature (Bergbauer,
2002). (b) Contours of maximum principal normal curvature,
1 , and tick marks parallel to direction of maximum
curvature.
–1
–0.5
0
0.5
1
1.5
2
2.5
3
3.5
x 10 –3
0
500
0
500
1000
1500
2000
0
500
0
500
1000
1500
2000
x (m)
y (m)
Curvature (m –1
)
x (m)
k max
(a)
(b)
k min
Hinge line
Crest line
y (m)