

3 km, but inadequate to document the vertical
variation. However, model fault surfaces can be
constructed and elastic boundary value problems
can be solved to find the variation in slip direction
with position over the entire model fault surface.
Then curves can be defined such that their
tangent line is everywhere parallel to the local relative slip direction. The three-dimensional variation in curvature and torsion of these curved lines
completely characterizes the geometry of relative
slip on the model fault. The local orientations of
these curves can be compared with the exposure
data for consistency.
3.3.2 Characterizing the shapes of folded
surfaces
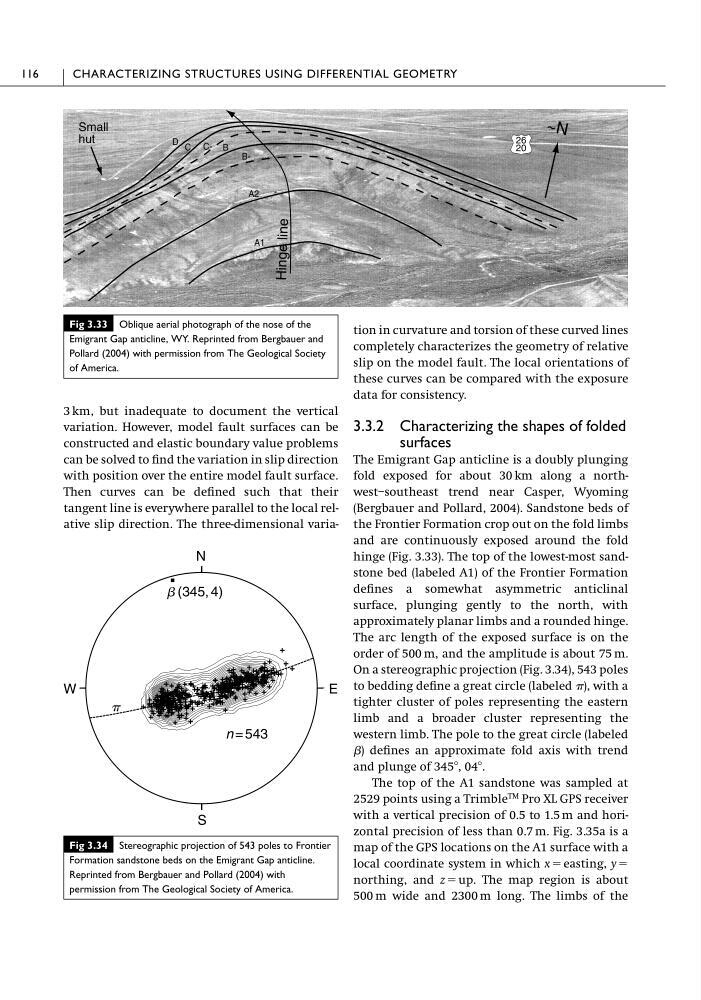
The Emigrant Gap anticline is a doubly plunging
fold exposed for about 30 km along a northwest–southeast trend near Casper, Wyoming
(Bergbauer and Pollard, 2004). Sandstone beds of
the Frontier Formation crop out on the fold limbs
and are continuously exposed around the fold
hinge (Fig. 3.33). The top of the lowest-most sandstone bed (labeled A1) of the Frontier Formation
defines a somewhat asymmetric anticlinal
surface, plunging gently to the north, with
approximately planar limbs and a rounded hinge.
The arc length of the exposed surface is on the
order of 500 m, and the amplitude is about 75 m.
On a stereographic projection (Fig. 3.34), 543 poles
to bedding define a great circle (labeled ), with a
tighter cluster of poles representing the eastern
limb and a broader cluster representing the
western limb. The pole to the great circle (labeled
) defines an approximate fold axis with trend
and plunge of 345Њ, 04Њ.
The top of the A1 sandstone was sampled at
2529 points using a Trimble
TM Pro XL GPS receiver
with a vertical precision of 0.5 to 1.5 m and horizontal precision of less than 0.7 m. Fig. 3.35a is a
map of the GPS locations on the A1 surface with a
local coordinate system in which x ϭ easting, y ϭ
northing, and z ϭ up. The map region is about
500 m wide and 2300 m long. The limbs of the
116
CHARACTERIZING STRUCTURES USING DIFFERENTIAL GEOMETRY
Fig 3.34 Stereographic projection of 543 poles to Frontier
Formation sandstone beds on the Emigrant Gap anticline.
Reprinted from Bergbauer and Pollard (2004) with
permission from The Geological Society of America.
n = 543
b (345, 4)
p
N
S
W
E
Fig 3.33 Oblique aerial photograph of the nose of the
Emigrant Gap anticline, WY. Reprinted from Bergbauer and
Pollard (2004) with permission from The Geological Society
of America.
A1
A2
B
C
D
B~ N
Hinge line
26
20
Small
hut
variation. However, model fault surfaces can be
constructed and elastic boundary value problems
can be solved to find the variation in slip direction
with position over the entire model fault surface.
Then curves can be defined such that their
tangent line is everywhere parallel to the local relative slip direction. The three-dimensional variation in curvature and torsion of these curved lines
completely characterizes the geometry of relative
slip on the model fault. The local orientations of
these curves can be compared with the exposure
data for consistency.
3.3.2 Characterizing the shapes of folded
surfaces
The Emigrant Gap anticline is a doubly plunging
fold exposed for about 30 km along a northwest–southeast trend near Casper, Wyoming
(Bergbauer and Pollard, 2004). Sandstone beds of
the Frontier Formation crop out on the fold limbs
and are continuously exposed around the fold
hinge (Fig. 3.33). The top of the lowest-most sandstone bed (labeled A1) of the Frontier Formation
defines a somewhat asymmetric anticlinal
surface, plunging gently to the north, with
approximately planar limbs and a rounded hinge.
The arc length of the exposed surface is on the
order of 500 m, and the amplitude is about 75 m.
On a stereographic projection (Fig. 3.34), 543 poles
to bedding define a great circle (labeled ), with a
tighter cluster of poles representing the eastern
limb and a broader cluster representing the
western limb. The pole to the great circle (labeled
) defines an approximate fold axis with trend
and plunge of 345Њ, 04Њ.
The top of the A1 sandstone was sampled at
2529 points using a Trimble
TM Pro XL GPS receiver
with a vertical precision of 0.5 to 1.5 m and horizontal precision of less than 0.7 m. Fig. 3.35a is a
map of the GPS locations on the A1 surface with a
local coordinate system in which x ϭ easting, y ϭ
northing, and z ϭ up. The map region is about
500 m wide and 2300 m long. The limbs of the
116
CHARACTERIZING STRUCTURES USING DIFFERENTIAL GEOMETRY
Fig 3.34 Stereographic projection of 543 poles to Frontier
Formation sandstone beds on the Emigrant Gap anticline.
Reprinted from Bergbauer and Pollard (2004) with
permission from The Geological Society of America.
n = 543
b (345, 4)
p
N
S
W
E
Fig 3.33 Oblique aerial photograph of the nose of the
Emigrant Gap anticline, WY. Reprinted from Bergbauer and
Pollard (2004) with permission from The Geological Society
of America.
A1
A2
B
C
D
B~ N
Hinge line
26
20
Small
hut