

15 Drought and Insolvency: Case Study of the Producer-Buyer …
497
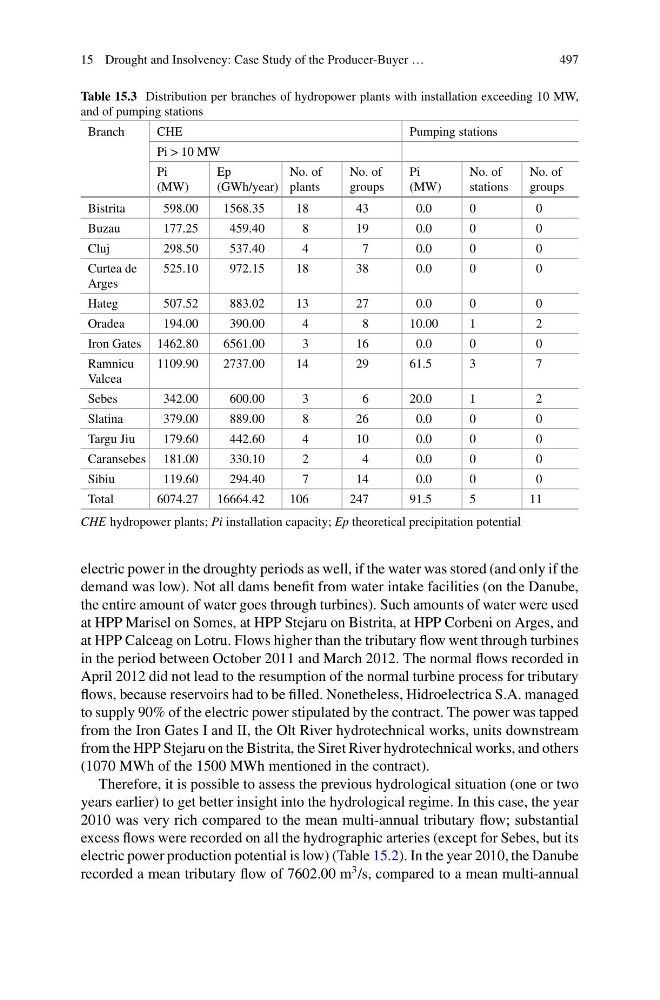
Table 15.3 Distribution per branches of hydropower plants with installation exceeding 10 MW,
and of pumping stations
Branch
CHE
Pumping stations
Pi > 10 MW
Pi
(MW)
Ep
(GWh/year)
No. of
plants
No. of
groups
Pi
(MW)
No. of
stations
No. of
groups
Bistrita
598.00
1568.35
18
43
0.0
0
0
Buzau
177.25
459.40
8
19
0.0
0
0
Cluj
298.50
537.40
4
7
0.0
0
0
Curtea de
Arges
525.10
972.15
18
38
0.0
0
0
Hateg
507.52
883.02
13
27
0.0
0
0
Oradea
194.00
390.00
4
8
10.00
1
2
Iron Gates 1462.80
6561.00
3
16
0.0
0
0
Ramnicu
Valcea
1109.90
2737.00
14
29
61.5
3
7
Sebes
342.00
600.00
3
6
20.0
1
2
Slatina
379.00
889.00
8
26
0.0
0
0
Targu Jiu
179.60
442.60
4
10
0.0
0
0
Caransebes 181.00
330.10
2
4
0.0
0
0
Sibiu
119.60
294.40
7
14
0.0
0
0
Total
6074.27 16664.42
106
247
91.5
5
11
CHE hydropower plants; Pi installation capacity; Ep theoretical precipitation potential
electric power in the droughty periods as well, if the water was stored (and only if the
demand was low). Not all dams benefit from water intake facilities (on the Danube,
the entire amount of water goes through turbines). Such amounts of water were used
at HPP Marisel on Somes, at HPP Stejaru on Bistrita, at HPP Corbeni on Arges, and
at HPP Calceag on Lotru. Flows higher than the tributary flow went through turbines
in the period between October 2011 and March 2012. The normal flows recorded in
April 2012 did not lead to the resumption of the normal turbine process for tributary
flows, because reservoirs had to be filled. Nonetheless, Hidroelectrica S.A. managed
to supply 90% of the electric power stipulated by the contract. The power was tapped
from the Iron Gates I and II, the Olt River hydrotechnical works, units downstream
from the HPP Stejaru on the Bistrita, the Siret River hydrotechnical works, and others
(1070 MWh of the 1500 MWh mentioned in the contract).
Therefore, it is possible to assess the previous hydrological situation (one or two
years earlier) to get better insight into the hydrological regime. In this case, the year
2010 was very rich compared to the mean multi-annual tributary flow; substantial
excess flows were recorded on all the hydrographic arteries (except for Sebes, but its
electric power production potential is low) (Table 15.2). In the year 2010, the Danube
recorded a mean tributary flow of 7602.00 m
3 /s, compared to a mean multi-annual
497
Table 15.3 Distribution per branches of hydropower plants with installation exceeding 10 MW,
and of pumping stations
Branch
CHE
Pumping stations
Pi > 10 MW
Pi
(MW)
Ep
(GWh/year)
No. of
plants
No. of
groups
Pi
(MW)
No. of
stations
No. of
groups
Bistrita
598.00
1568.35
18
43
0.0
0
0
Buzau
177.25
459.40
8
19
0.0
0
0
Cluj
298.50
537.40
4
7
0.0
0
0
Curtea de
Arges
525.10
972.15
18
38
0.0
0
0
Hateg
507.52
883.02
13
27
0.0
0
0
Oradea
194.00
390.00
4
8
10.00
1
2
Iron Gates 1462.80
6561.00
3
16
0.0
0
0
Ramnicu
Valcea
1109.90
2737.00
14
29
61.5
3
7
Sebes
342.00
600.00
3
6
20.0
1
2
Slatina
379.00
889.00
8
26
0.0
0
0
Targu Jiu
179.60
442.60
4
10
0.0
0
0
Caransebes 181.00
330.10
2
4
0.0
0
0
Sibiu
119.60
294.40
7
14
0.0
0
0
Total
6074.27 16664.42
106
247
91.5
5
11
CHE hydropower plants; Pi installation capacity; Ep theoretical precipitation potential
electric power in the droughty periods as well, if the water was stored (and only if the
demand was low). Not all dams benefit from water intake facilities (on the Danube,
the entire amount of water goes through turbines). Such amounts of water were used
at HPP Marisel on Somes, at HPP Stejaru on Bistrita, at HPP Corbeni on Arges, and
at HPP Calceag on Lotru. Flows higher than the tributary flow went through turbines
in the period between October 2011 and March 2012. The normal flows recorded in
April 2012 did not lead to the resumption of the normal turbine process for tributary
flows, because reservoirs had to be filled. Nonetheless, Hidroelectrica S.A. managed
to supply 90% of the electric power stipulated by the contract. The power was tapped
from the Iron Gates I and II, the Olt River hydrotechnical works, units downstream
from the HPP Stejaru on the Bistrita, the Siret River hydrotechnical works, and others
(1070 MWh of the 1500 MWh mentioned in the contract).
Therefore, it is possible to assess the previous hydrological situation (one or two
years earlier) to get better insight into the hydrological regime. In this case, the year
2010 was very rich compared to the mean multi-annual tributary flow; substantial
excess flows were recorded on all the hydrographic arteries (except for Sebes, but its
electric power production potential is low) (Table 15.2). In the year 2010, the Danube
recorded a mean tributary flow of 7602.00 m
3 /s, compared to a mean multi-annual