

444
D. C. Diaconu
mitigation of the stream flows. It is determining at the downstream point of the
embanked sector (Braila) an increase of the stream flows in comparison to the period
prior to the embankment. As a multiyear mean, the increase was one of 290 m
3 /s
(the multiyear average stream flow before the embankment was 5980 m
3 /s, and
after the embankment it rose to 6280 m
3 /s). The maximum average stream flow
prior to the embankment, 10,170 m
3 /s, has risen as a result of the embankment
to 11,030 m
3 /s. The maximum average stream flow, 15,800 m
3 /s, was registered
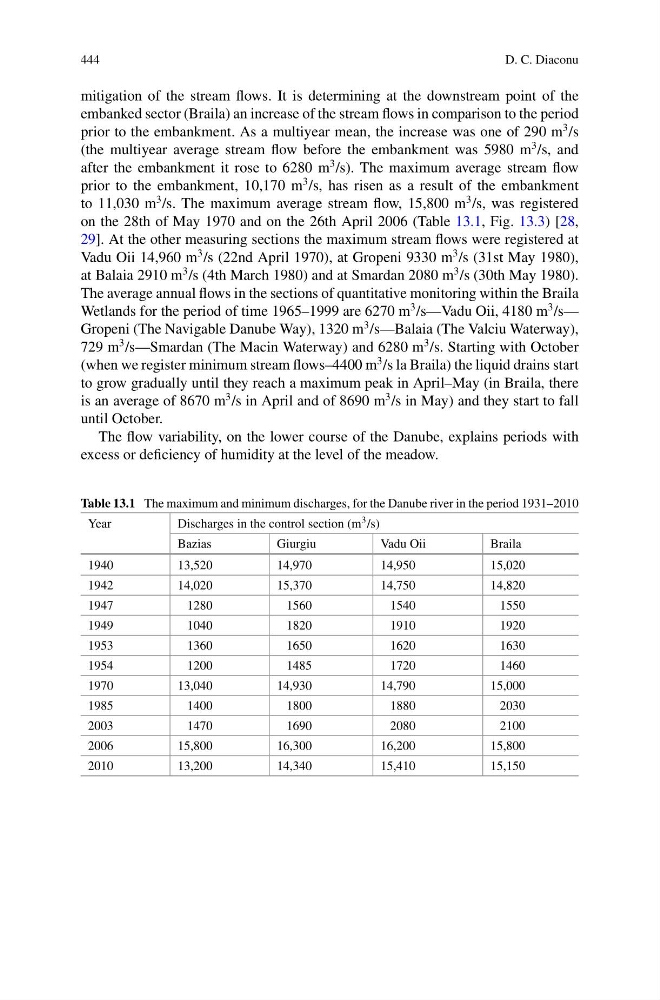
on the 28th of May 1970 and on the 26th April 2006 (Table 13.1, Fig. 13.3) [28,
29]. At the other measuring sections the maximum stream flows were registered at
Vadu Oii 14,960 m
3 /s (22nd April 1970), at Gropeni 9330 m
3 /s (31st May 1980),
at Balaia 2910 m
3 /s (4th March 1980) and at Smardan 2080 m
3 /s (30th May 1980).
The average annual flows in the sections of quantitative monitoring within the Braila
Wetlands for the period of time 1965–1999 are 6270 m
3 /s—Vadu Oii, 4180 m
3 /s—
Gropeni (The Navigable Danube Way), 1320 m
3 /s—Balaia (The Valciu Waterway),
729 m
3 /s—Smardan (The Macin Waterway) and 6280 m
3 /s. Starting with October
(when we register minimum stream flows–4400 m
3 /s la Braila) the liquid drains start
to grow gradually until they reach a maximum peak in April–May (in Braila, there
is an average of 8670 m
3 /s in April and of 8690 m
3 /s in May) and they start to fall
until October.
The flow variability, on the lower course of the Danube, explains periods with
excess or deficiency of humidity at the level of the meadow.
Table 13.1 The maximum and minimum discharges, for the Danube river in the period 1931–2010
Year
Discharges in the control section (m 3 /s)
Bazias
Giurgiu
Vadu Oii
Braila
1940
13,520
14,970
14,950
15,020
1942
14,020
15,370
14,750
14,820
1947
1280
1560
1540
1550
1949
1040
1820
1910
1920
1953
1360
1650
1620
1630
1954
1200
1485
1720
1460
1970
13,040
14,930
14,790
15,000
1985
1400
1800
1880
2030
2003
1470
1690
2080
2100
2006
15,800
16,300
16,200
15,800
2010
13,200
14,340
15,410
15,150
D. C. Diaconu
mitigation of the stream flows. It is determining at the downstream point of the
embanked sector (Braila) an increase of the stream flows in comparison to the period
prior to the embankment. As a multiyear mean, the increase was one of 290 m
3 /s
(the multiyear average stream flow before the embankment was 5980 m
3 /s, and
after the embankment it rose to 6280 m
3 /s). The maximum average stream flow
prior to the embankment, 10,170 m
3 /s, has risen as a result of the embankment
to 11,030 m
3 /s. The maximum average stream flow, 15,800 m
3 /s, was registered
on the 28th of May 1970 and on the 26th April 2006 (Table 13.1, Fig. 13.3) [28,
29]. At the other measuring sections the maximum stream flows were registered at
Vadu Oii 14,960 m
3 /s (22nd April 1970), at Gropeni 9330 m
3 /s (31st May 1980),
at Balaia 2910 m
3 /s (4th March 1980) and at Smardan 2080 m
3 /s (30th May 1980).
The average annual flows in the sections of quantitative monitoring within the Braila
Wetlands for the period of time 1965–1999 are 6270 m
3 /s—Vadu Oii, 4180 m
3 /s—
Gropeni (The Navigable Danube Way), 1320 m
3 /s—Balaia (The Valciu Waterway),
729 m
3 /s—Smardan (The Macin Waterway) and 6280 m
3 /s. Starting with October
(when we register minimum stream flows–4400 m
3 /s la Braila) the liquid drains start
to grow gradually until they reach a maximum peak in April–May (in Braila, there
is an average of 8670 m
3 /s in April and of 8690 m
3 /s in May) and they start to fall
until October.
The flow variability, on the lower course of the Danube, explains periods with
excess or deficiency of humidity at the level of the meadow.
Table 13.1 The maximum and minimum discharges, for the Danube river in the period 1931–2010
Year
Discharges in the control section (m 3 /s)
Bazias
Giurgiu
Vadu Oii
Braila
1940
13,520
14,970
14,950
15,020
1942
14,020
15,370
14,750
14,820
1947
1280
1560
1540
1550
1949
1040
1820
1910
1920
1953
1360
1650
1620
1630
1954
1200
1485
1720
1460
1970
13,040
14,930
14,790
15,000
1985
1400
1800
1880
2030
2003
1470
1690
2080
2100
2006
15,800
16,300
16,200
15,800
2010
13,200
14,340
15,410
15,150