

12 Water Resources from Romanian Upper Tisa Basin
415
Table 12.1 The distribution of water resources in the Upper Tisa Romanian Basin (multiannual
average values, related to a dry year—1990) [41] (R.W.N.A. 2013)
River
basin
district
Area
(km 2 )
Average conditions
Dry year 1990
Annual
average
flow
(m 3 /s)
Volume
(mil. m 3 )
Average
flow
(m 3 /s)
Volume
(mil. m 3 )
Q 1990
(m 3 /s)
Upper Tisa 4540
66
2082
50
1578
76
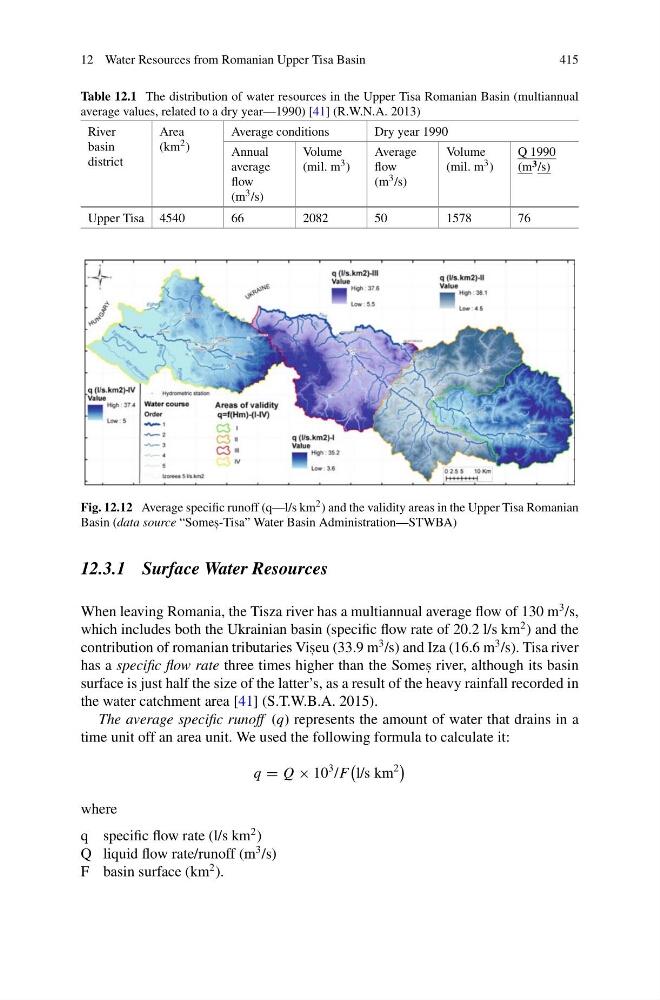
Fig. 12.12 Average specific runoff (q—l/s km 2 ) and the validity areas in the Upper Tisa Romanian
Basin (data source “Somes , -Tisa” Water Basin Administration—STWBA)
12.3.1 Surface Water Resources
When leaving Romania, the Tisza river has a multiannual average flow of 130 m
3 /s,
which includes both the Ukrainian basin (specific flow rate of 20.2 l/s km
2 ) and the
contribution of romanian tributaries Vis , eu (33.9 m
3 /s) and Iza (16.6 m
3 /s). Tisa river
has a specific flow rate three times higher than the Somes , river, although its basin
surface is just half the size of the latter’s, as a result of the heavy rainfall recorded in
the water catchment area [41] (S.T.W.B.A. 2015).
The average specific runoff (q) represents the amount of water that drains in a
time unit off an area unit. We used the following formula to calculate it:
q = Q × 10
3 /F
l/s km
2
where
q specific flow rate (l/s km
2 )
Q liquid flow rate/runoff (m
3 /s)
F basin surface (km
2 ).
415
Table 12.1 The distribution of water resources in the Upper Tisa Romanian Basin (multiannual
average values, related to a dry year—1990) [41] (R.W.N.A. 2013)
River
basin
district
Area
(km 2 )
Average conditions
Dry year 1990
Annual
average
flow
(m 3 /s)
Volume
(mil. m 3 )
Average
flow
(m 3 /s)
Volume
(mil. m 3 )
Q 1990
(m 3 /s)
Upper Tisa 4540
66
2082
50
1578
76
Fig. 12.12 Average specific runoff (q—l/s km 2 ) and the validity areas in the Upper Tisa Romanian
Basin (data source “Somes , -Tisa” Water Basin Administration—STWBA)
12.3.1 Surface Water Resources
When leaving Romania, the Tisza river has a multiannual average flow of 130 m
3 /s,
which includes both the Ukrainian basin (specific flow rate of 20.2 l/s km
2 ) and the
contribution of romanian tributaries Vis , eu (33.9 m
3 /s) and Iza (16.6 m
3 /s). Tisa river
has a specific flow rate three times higher than the Somes , river, although its basin
surface is just half the size of the latter’s, as a result of the heavy rainfall recorded in
the water catchment area [41] (S.T.W.B.A. 2015).
The average specific runoff (q) represents the amount of water that drains in a
time unit off an area unit. We used the following formula to calculate it:
q = Q × 10
3 /F
l/s km
2
where
q specific flow rate (l/s km
2 )
Q liquid flow rate/runoff (m
3 /s)
F basin surface (km
2 ).