

154
F. Morar et al.
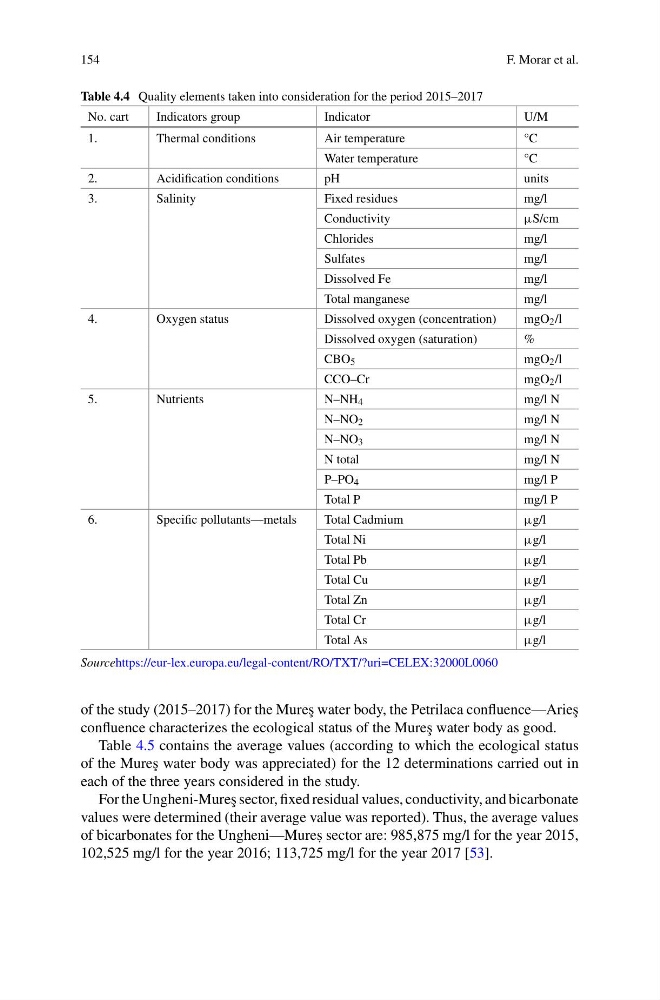
Table 4.4 Quality elements taken into consideration for the period 2015–2017
No. cart
Indicators group
Indicator
U/M
1.
Thermal conditions
Air temperature
°C
Water temperature
°C
2.
Acidification conditions
pH
units
3.
Salinity
Fixed residues
mg/l
Conductivity
µS/cm
Chlorides
mg/l
Sulfates
mg/l
Dissolved Fe
mg/l
Total manganese
mg/l
4.
Oxygen status
Dissolved oxygen (concentration)
mgO 2 /l
Dissolved oxygen (saturation)
%
CBO 5
mgO 2 /l
CCO–Cr
mgO 2 /l
5.
Nutrients
N–NH 4
mg/l N
N–NO 2
mg/l N
N–NO 3
mg/l N
N total
mg/l N
P–PO 4
mg/l P
Total P
mg/l P
6.
Specific pollutants—metals
Total Cadmium
µg/l
Total Ni
µg/l
Total Pb
µg/l
Total Cu
µg/l
Total Zn
µg/l
Total Cr
µg/l
Total As
µg/l
Sourcehttps://eur-lex.europa.eu/legal-content/RO/TXT/?uri=CELEX:32000L0060
of the study (2015–2017) for the Mure¸ s water body, the Petrilaca confluence—Arie¸ s
confluence characterizes the ecological status of the Mure¸ s water body as good.
Table 4.5 contains the average values (according to which the ecological status
of the Mure¸ s water body was appreciated) for the 12 determinations carried out in
each of the three years considered in the study.
For the Ungheni-Mure¸ s sector, fixed residual values, conductivity, and bicarbonate
values were determined (their average value was reported). Thus, the average values
of bicarbonates for the Ungheni—Mures , sector are: 985,875 mg/l for the year 2015,
102,525 mg/l for the year 2016; 113,725 mg/l for the year 2017 [53].
F. Morar et al.
Table 4.4 Quality elements taken into consideration for the period 2015–2017
No. cart
Indicators group
Indicator
U/M
1.
Thermal conditions
Air temperature
°C
Water temperature
°C
2.
Acidification conditions
pH
units
3.
Salinity
Fixed residues
mg/l
Conductivity
µS/cm
Chlorides
mg/l
Sulfates
mg/l
Dissolved Fe
mg/l
Total manganese
mg/l
4.
Oxygen status
Dissolved oxygen (concentration)
mgO 2 /l
Dissolved oxygen (saturation)
%
CBO 5
mgO 2 /l
CCO–Cr
mgO 2 /l
5.
Nutrients
N–NH 4
mg/l N
N–NO 2
mg/l N
N–NO 3
mg/l N
N total
mg/l N
P–PO 4
mg/l P
Total P
mg/l P
6.
Specific pollutants—metals
Total Cadmium
µg/l
Total Ni
µg/l
Total Pb
µg/l
Total Cu
µg/l
Total Zn
µg/l
Total Cr
µg/l
Total As
µg/l
Sourcehttps://eur-lex.europa.eu/legal-content/RO/TXT/?uri=CELEX:32000L0060
of the study (2015–2017) for the Mure¸ s water body, the Petrilaca confluence—Arie¸ s
confluence characterizes the ecological status of the Mure¸ s water body as good.
Table 4.5 contains the average values (according to which the ecological status
of the Mure¸ s water body was appreciated) for the 12 determinations carried out in
each of the three years considered in the study.
For the Ungheni-Mure¸ s sector, fixed residual values, conductivity, and bicarbonate
values were determined (their average value was reported). Thus, the average values
of bicarbonates for the Ungheni—Mures , sector are: 985,875 mg/l for the year 2015,
102,525 mg/l for the year 2016; 113,725 mg/l for the year 2017 [53].