

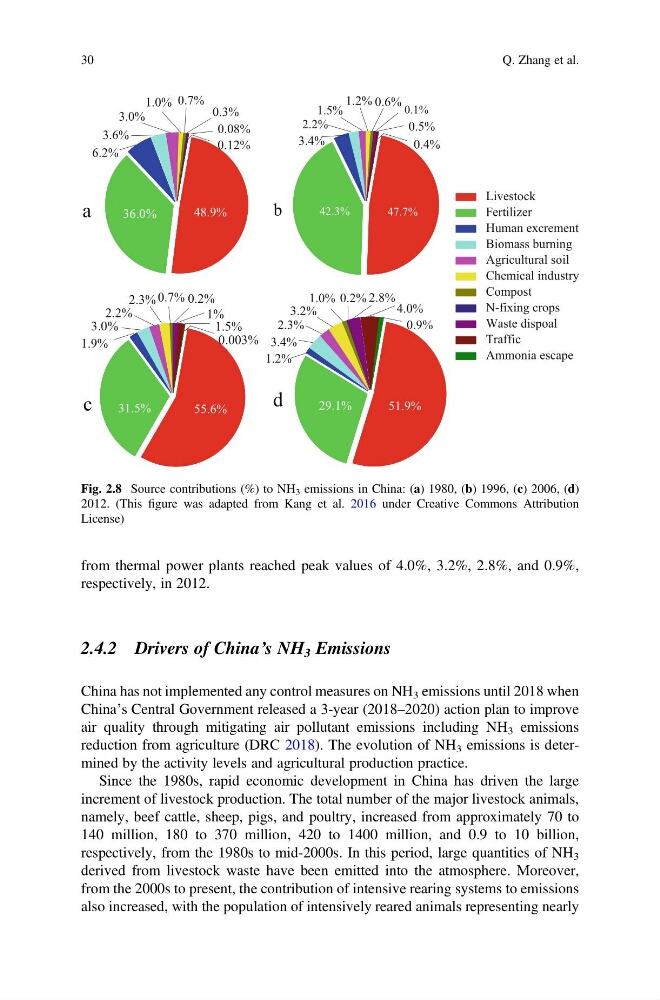
from thermal power plants reached peak values of 4.0%, 3.2%, 2.8%, and 0.9%,
respectively, in 2012.
2.4.2 Drivers of China’s NH 3 Emissions
China has not implemented any control measures on NH 3 emissions until 2018 when
China’s Central Government released a 3-year (2018–2020) action plan to improve
air quality through mitigating air pollutant emissions including NH 3 emissions
reduction from agriculture (DRC 2018). The evolution of NH 3 emissions is determined by the activity levels and agricultural production practice.
Since the 1980s, rapid economic development in China has driven the large
increment of livestock production. The total number of the major livestock animals,
namely, beef cattle, sheep, pigs, and poultry, increased from approximately 70 to
140 million, 180 to 370 million, 420 to 1400 million, and 0.9 to 10 billion,
respectively, from the 1980s to mid-2000s. In this period, large quantities of NH 3
derived from livestock waste have been emitted into the atmosphere. Moreover,
from the 2000s to present, the contribution of intensive rearing systems to emissions
also increased, with the population of intensively reared animals representing nearly
Livestock
Fertilizer
Human excrement
Biomass burning
Agricultural soil
Chemical industry
Compost
N-fixing crops
Waste dispoal
Traffic
Ammonia escape
51.9%
29.1%
0.9%
4.0%
2.8%
0.2%
1.0%
3.2%
2.3%
3.4%
1.2%
d
c
0.003%
1.5%
1%
0.2%
0.7%
2.3%
2.2%
3.0%
1.9%
55.6%
31.5%
b
0.1%
47.7%
1.2%
1.5%
2.2%
3.4%
42.3%
0.6%
0.5%
0.4%
a
0.12%
0.08%
0.7%
3.0%
3.6%
1.0%
6.2%
48.9%
36.0%
0.3%
Fig. 2.8 Source contributions (%) to NH 3 emissions in China: (a) 1980, (b) 1996, (c) 2006, (d)
2012. (This figure was adapted from Kang et al. 2016 under Creative Commons Attribution
License)
30
Q. Zhang et al.
respectively, in 2012.
2.4.2 Drivers of China’s NH 3 Emissions
China has not implemented any control measures on NH 3 emissions until 2018 when
China’s Central Government released a 3-year (2018–2020) action plan to improve
air quality through mitigating air pollutant emissions including NH 3 emissions
reduction from agriculture (DRC 2018). The evolution of NH 3 emissions is determined by the activity levels and agricultural production practice.
Since the 1980s, rapid economic development in China has driven the large
increment of livestock production. The total number of the major livestock animals,
namely, beef cattle, sheep, pigs, and poultry, increased from approximately 70 to
140 million, 180 to 370 million, 420 to 1400 million, and 0.9 to 10 billion,
respectively, from the 1980s to mid-2000s. In this period, large quantities of NH 3
derived from livestock waste have been emitted into the atmosphere. Moreover,
from the 2000s to present, the contribution of intensive rearing systems to emissions
also increased, with the population of intensively reared animals representing nearly
Livestock
Fertilizer
Human excrement
Biomass burning
Agricultural soil
Chemical industry
Compost
N-fixing crops
Waste dispoal
Traffic
Ammonia escape
51.9%
29.1%
0.9%
4.0%
2.8%
0.2%
1.0%
3.2%
2.3%
3.4%
1.2%
d
c
0.003%
1.5%
1%
0.2%
0.7%
2.3%
2.2%
3.0%
1.9%
55.6%
31.5%
b
0.1%
47.7%
1.2%
1.5%
2.2%
3.4%
42.3%
0.6%
0.5%
0.4%
a
0.12%
0.08%
0.7%
3.0%
3.6%
1.0%
6.2%
48.9%
36.0%
0.3%
Fig. 2.8 Source contributions (%) to NH 3 emissions in China: (a) 1980, (b) 1996, (c) 2006, (d)
2012. (This figure was adapted from Kang et al. 2016 under Creative Commons Attribution
License)
30
Q. Zhang et al.