

August), which can be attributed to the high temperatures and intensive application
of fertilizer. The seasonal distribution of synthetic fertilizer emissions was almost
constant from 1980 to 2012, corresponding to stability in the seasonal distribution of
agricultural activities.
Other sources (except synthetic fertilizer and livestock) made no notable contribution to the total budget due to their relatively low levels; nevertheless, some of
these sources exhibited distinct variation during this period. For example, NH 3
emissions released by biomass burning generally increased, of which crop-residue
burning and housing fuelwood combustion jointly accounted for a large proportion
of the biomass burning emissions. Particularly, in 1987, a large forest fire occurring
in the Greater Khingan Mountains, located in Heilongjiang Province, released more
than 10 Gg NH 3 . NH 3 escape derived from the denitrification process in thermal
power plants increased substantially, as the implementation of flue gas denitrification has rapidly increased in the past 10 years, especially in 2012. NH 3 emissions
from human excrement decreased from 362 Gg (6.2% of total) to 121 Gg (1.3% of
total), due to rural depopulation and improvements in sanitary conditions over the
past three decades. The contributions of different sources to total NH 3 emissions in
1980, 1996, 2006, and 2012 are illustrated in Fig. 2.8. Emissions from livestock and
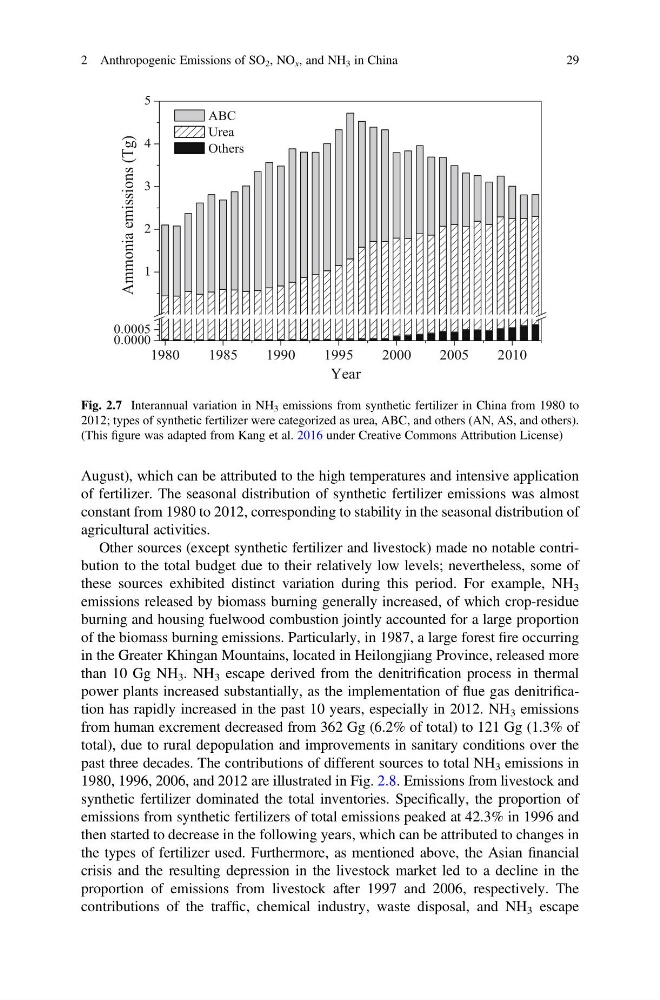
synthetic fertilizer dominated the total inventories. Specifically, the proportion of
emissions from synthetic fertilizers of total emissions peaked at 42.3% in 1996 and
then started to decrease in the following years, which can be attributed to changes in
the types of fertilizer used. Furthermore, as mentioned above, the Asian financial
crisis and the resulting depression in the livestock market led to a decline in the
proportion of emissions from livestock after 1997 and 2006, respectively. The
contributions of the traffic, chemical industry, waste disposal, and NH 3 escape
1980
1985
1990
1995
2000
2005
2010
0.0000
0.0005
1
2
3
4
5
)
g
T
(
s
n
o
i
s
s
i
m
e
a
i
n
o
m
m
A
Year
ABC
Urea
Others
Fig. 2.7 Interannual variation in NH 3 emissions from synthetic fertilizer in China from 1980 to
2012; types of synthetic fertilizer were categorized as urea, ABC, and others (AN, AS, and others).
(This figure was adapted from Kang et al. 2016 under Creative Commons Attribution License)
2 Anthropogenic Emissions of SO 2 , NO x , and NH 3 in China
29
of fertilizer. The seasonal distribution of synthetic fertilizer emissions was almost
constant from 1980 to 2012, corresponding to stability in the seasonal distribution of
agricultural activities.
Other sources (except synthetic fertilizer and livestock) made no notable contribution to the total budget due to their relatively low levels; nevertheless, some of
these sources exhibited distinct variation during this period. For example, NH 3
emissions released by biomass burning generally increased, of which crop-residue
burning and housing fuelwood combustion jointly accounted for a large proportion
of the biomass burning emissions. Particularly, in 1987, a large forest fire occurring
in the Greater Khingan Mountains, located in Heilongjiang Province, released more
than 10 Gg NH 3 . NH 3 escape derived from the denitrification process in thermal
power plants increased substantially, as the implementation of flue gas denitrification has rapidly increased in the past 10 years, especially in 2012. NH 3 emissions
from human excrement decreased from 362 Gg (6.2% of total) to 121 Gg (1.3% of
total), due to rural depopulation and improvements in sanitary conditions over the
past three decades. The contributions of different sources to total NH 3 emissions in
1980, 1996, 2006, and 2012 are illustrated in Fig. 2.8. Emissions from livestock and
synthetic fertilizer dominated the total inventories. Specifically, the proportion of
emissions from synthetic fertilizers of total emissions peaked at 42.3% in 1996 and
then started to decrease in the following years, which can be attributed to changes in
the types of fertilizer used. Furthermore, as mentioned above, the Asian financial
crisis and the resulting depression in the livestock market led to a decline in the
proportion of emissions from livestock after 1997 and 2006, respectively. The
contributions of the traffic, chemical industry, waste disposal, and NH 3 escape
1980
1985
1990
1995
2000
2005
2010
0.0000
0.0005
1
2
3
4
5
)
g
T
(
s
n
o
i
s
s
i
m
e
a
i
n
o
m
m
A
Year
ABC
Urea
Others
Fig. 2.7 Interannual variation in NH 3 emissions from synthetic fertilizer in China from 1980 to
2012; types of synthetic fertilizer were categorized as urea, ABC, and others (AN, AS, and others).
(This figure was adapted from Kang et al. 2016 under Creative Commons Attribution License)
2 Anthropogenic Emissions of SO 2 , NO x , and NH 3 in China
29