

slightly from 2011 to 2014. Uncertainties in emission estimation could be part of the
reason for the inconsistency. For example, the actual emissions may be larger than
expected if poor management of FGD prevailed motivated by economic incentives
(Zhao et al. 2013). With limited additional potential for FGD installation, the
reduced SO 2 VCD after 2012 could be attributed partly to the improvement in
FGD operation. In September 2013, the Chinese State Council issued the National
Action Plan on Prevention and Control of Air Pollution, requiring elevated controls
of pollutant emissions (Zhao et al. 2014). As illustrated in Fig. 14.4, the SO 2
emissions in STD agree better with VCDs than those in PRI, implying that STD
could be more representative for the implementation of post-2010 emission standards than PRI. The uncertainty from satellite retrievals may also result in the
inconsistencies between emissions and VCD. Compared to ground concentration,
for example, vertical density through the whole atmospheric column could be less
representative for anthropogenic emissions mainly from surface.
The NO 2 VCDs grew by 71% from 2005 to 2011 and then declined by 18% from
2011 to 2014, consistent with the bottom-up estimates of NO X emissions. The
reduction in satellite-derived VCDs thus indicates the substantial abatement of
emissions within the 12th FYP period. In general, the estimates of emissions in
STD are more consistent with the inter-annual variation in satellite-derived VCDs
for both species than those in PRI. The comparison implies that China’s actions in air
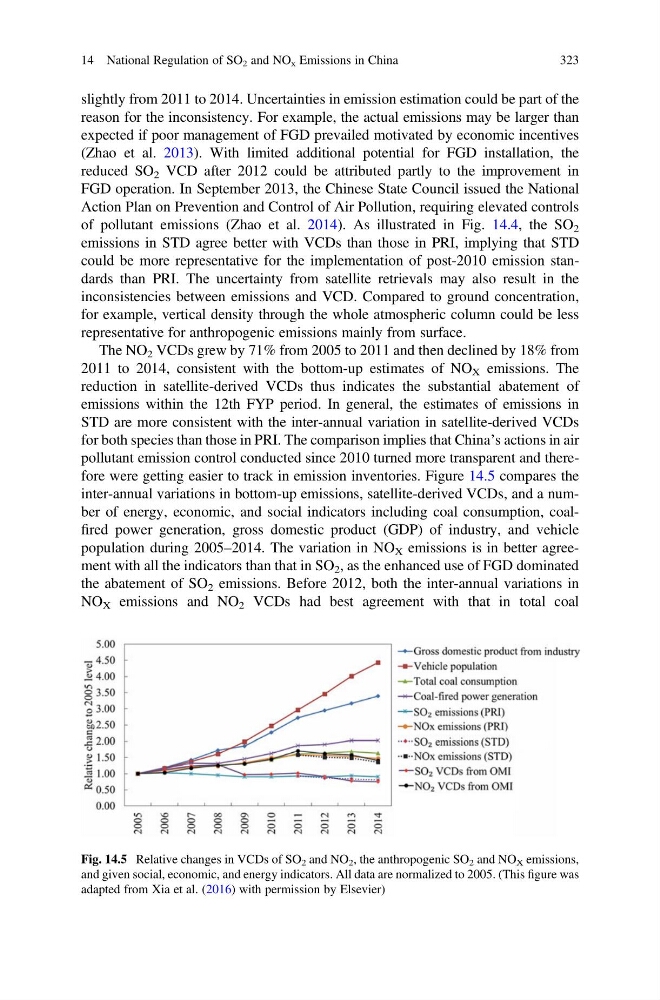
pollutant emission control conducted since 2010 turned more transparent and therefore were getting easier to track in emission inventories. Figure 14.5 compares the
inter-annual variations in bottom-up emissions, satellite-derived VCDs, and a number of energy, economic, and social indicators including coal consumption, coalfired power generation, gross domestic product (GDP) of industry, and vehicle
population during 2005–2014. The variation in NO X emissions is in better agreement with all the indicators than that in SO 2 , as the enhanced use of FGD dominated
the abatement of SO 2 emissions. Before 2012, both the inter-annual variations in
NO X emissions and NO 2 VCDs had best agreement with that in total coal
Fig. 14.5 Relative changes in VCDs of SO 2 and NO 2 , the anthropogenic SO 2 and NO X emissions,
and given social, economic, and energy indicators. All data are normalized to 2005. (This figure was
adapted from Xia et al. (2016) with permission by Elsevier)
14 National Regulation of SO 2 and NO x Emissions in China
323
reason for the inconsistency. For example, the actual emissions may be larger than
expected if poor management of FGD prevailed motivated by economic incentives
(Zhao et al. 2013). With limited additional potential for FGD installation, the
reduced SO 2 VCD after 2012 could be attributed partly to the improvement in
FGD operation. In September 2013, the Chinese State Council issued the National
Action Plan on Prevention and Control of Air Pollution, requiring elevated controls
of pollutant emissions (Zhao et al. 2014). As illustrated in Fig. 14.4, the SO 2
emissions in STD agree better with VCDs than those in PRI, implying that STD
could be more representative for the implementation of post-2010 emission standards than PRI. The uncertainty from satellite retrievals may also result in the
inconsistencies between emissions and VCD. Compared to ground concentration,
for example, vertical density through the whole atmospheric column could be less
representative for anthropogenic emissions mainly from surface.
The NO 2 VCDs grew by 71% from 2005 to 2011 and then declined by 18% from
2011 to 2014, consistent with the bottom-up estimates of NO X emissions. The
reduction in satellite-derived VCDs thus indicates the substantial abatement of
emissions within the 12th FYP period. In general, the estimates of emissions in
STD are more consistent with the inter-annual variation in satellite-derived VCDs
for both species than those in PRI. The comparison implies that China’s actions in air
pollutant emission control conducted since 2010 turned more transparent and therefore were getting easier to track in emission inventories. Figure 14.5 compares the
inter-annual variations in bottom-up emissions, satellite-derived VCDs, and a number of energy, economic, and social indicators including coal consumption, coalfired power generation, gross domestic product (GDP) of industry, and vehicle
population during 2005–2014. The variation in NO X emissions is in better agreement with all the indicators than that in SO 2 , as the enhanced use of FGD dominated
the abatement of SO 2 emissions. Before 2012, both the inter-annual variations in
NO X emissions and NO 2 VCDs had best agreement with that in total coal
Fig. 14.5 Relative changes in VCDs of SO 2 and NO 2 , the anthropogenic SO 2 and NO X emissions,
and given social, economic, and energy indicators. All data are normalized to 2005. (This figure was
adapted from Xia et al. (2016) with permission by Elsevier)
14 National Regulation of SO 2 and NO x Emissions in China
323