

resolution of 0.125 Â 0.125
are used (http://www.temis.nl/airpollution/no2col/
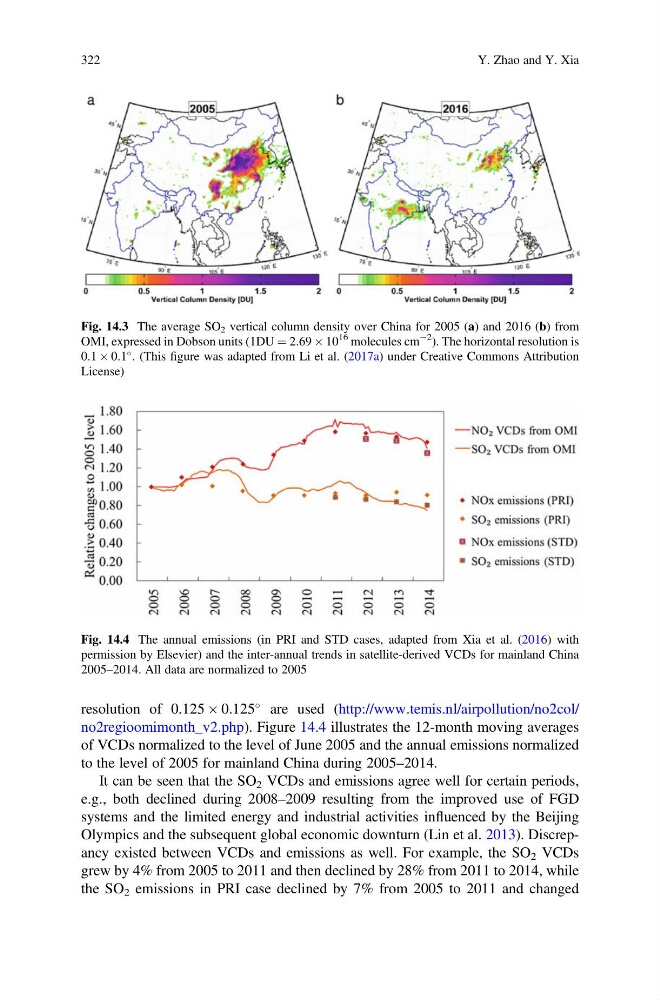
no2regioomimonth_v2.php). Figure 14.4 illustrates the 12-month moving averages
of VCDs normalized to the level of June 2005 and the annual emissions normalized
to the level of 2005 for mainland China during 2005–2014.
It can be seen that the SO 2 VCDs and emissions agree well for certain periods,
e.g., both declined during 2008–2009 resulting from the improved use of FGD
systems and the limited energy and industrial activities influenced by the Beijing
Olympics and the subsequent global economic downturn (Lin et al. 2013). Discrepancy existed between VCDs and emissions as well. For example, the SO 2 VCDs
grew by 4% from 2005 to 2011 and then declined by 28% from 2011 to 2014, while
the SO 2 emissions in PRI case declined by 7% from 2005 to 2011 and changed
Fig. 14.3 The average SO 2 vertical column density over China for 2005 (a) and 2016 (b) from
OMI, expressed in Dobson units (1DU ¼ 2.69 Â 10
16 molecules cm
À2
). The horizontal resolution is
0.1 Â 0.1
. (This figure was adapted from Li et al. (2017a) under Creative Commons Attribution
License)
Fig. 14.4 The annual emissions (in PRI and STD cases, adapted from Xia et al. (2016) with
permission by Elsevier) and the inter-annual trends in satellite-derived VCDs for mainland China
2005–2014. All data are normalized to 2005
322
Y. Zhao and Y. Xia
are used (http://www.temis.nl/airpollution/no2col/
no2regioomimonth_v2.php). Figure 14.4 illustrates the 12-month moving averages
of VCDs normalized to the level of June 2005 and the annual emissions normalized
to the level of 2005 for mainland China during 2005–2014.
It can be seen that the SO 2 VCDs and emissions agree well for certain periods,
e.g., both declined during 2008–2009 resulting from the improved use of FGD
systems and the limited energy and industrial activities influenced by the Beijing
Olympics and the subsequent global economic downturn (Lin et al. 2013). Discrepancy existed between VCDs and emissions as well. For example, the SO 2 VCDs
grew by 4% from 2005 to 2011 and then declined by 28% from 2011 to 2014, while
the SO 2 emissions in PRI case declined by 7% from 2005 to 2011 and changed
Fig. 14.3 The average SO 2 vertical column density over China for 2005 (a) and 2016 (b) from
OMI, expressed in Dobson units (1DU ¼ 2.69 Â 10
16 molecules cm
À2
). The horizontal resolution is
0.1 Â 0.1
. (This figure was adapted from Li et al. (2017a) under Creative Commons Attribution
License)
Fig. 14.4 The annual emissions (in PRI and STD cases, adapted from Xia et al. (2016) with
permission by Elsevier) and the inter-annual trends in satellite-derived VCDs for mainland China
2005–2014. All data are normalized to 2005
322
Y. Zhao and Y. Xia