

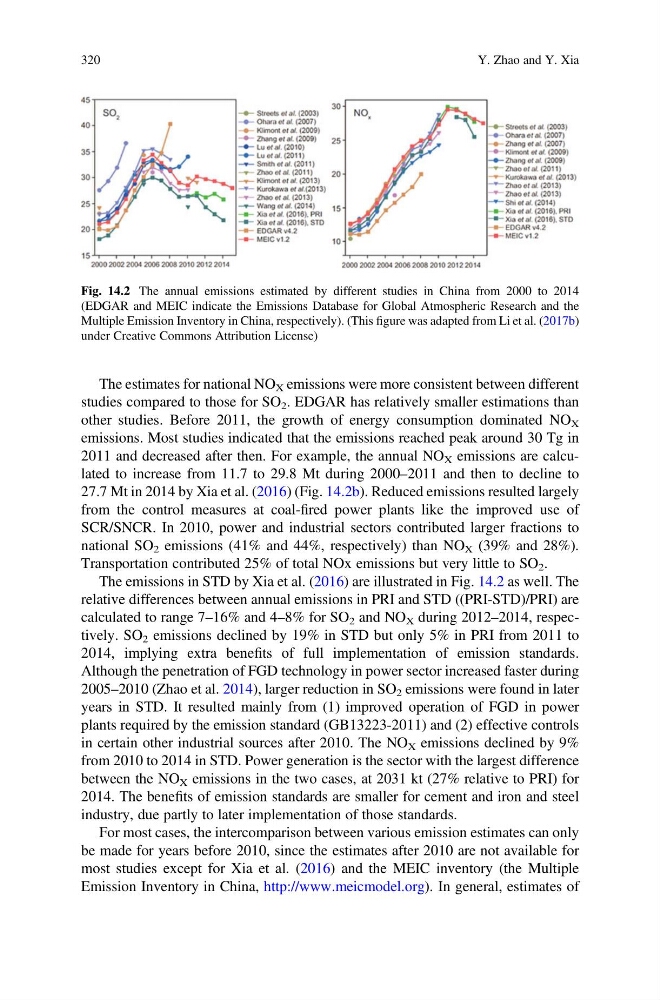
The estimates for national NO X emissions were more consistent between different
studies compared to those for SO 2 . EDGAR has relatively smaller estimations than
other studies. Before 2011, the growth of energy consumption dominated NO X
emissions. Most studies indicated that the emissions reached peak around 30 Tg in
2011 and decreased after then. For example, the annual NO X emissions are calculated to increase from 11.7 to 29.8 Mt during 2000–2011 and then to decline to
27.7 Mt in 2014 by Xia et al. (2016) (Fig. 14.2b). Reduced emissions resulted largely
from the control measures at coal-fired power plants like the improved use of
SCR/SNCR. In 2010, power and industrial sectors contributed larger fractions to
national SO 2 emissions (41% and 44%, respectively) than NO X (39% and 28%).
Transportation contributed 25% of total NOx emissions but very little to SO 2 .
The emissions in STD by Xia et al. (2016) are illustrated in Fig. 14.2 as well. The
relative differences between annual emissions in PRI and STD ((PRI-STD)/PRI) are
calculated to range 7–16% and 4–8% for SO 2 and NO X during 2012–2014, respectively. SO 2 emissions declined by 19% in STD but only 5% in PRI from 2011 to
2014, implying extra benefits of full implementation of emission standards.
Although the penetration of FGD technology in power sector increased faster during
2005–2010 (Zhao et al. 2014), larger reduction in SO 2 emissions were found in later
years in STD. It resulted mainly from (1) improved operation of FGD in power
plants required by the emission standard (GB13223-2011) and (2) effective controls
in certain other industrial sources after 2010. The NO X emissions declined by 9%
from 2010 to 2014 in STD. Power generation is the sector with the largest difference
between the NO X emissions in the two cases, at 2031 kt (27% relative to PRI) for
2014. The benefits of emission standards are smaller for cement and iron and steel
industry, due partly to later implementation of those standards.
For most cases, the intercomparison between various emission estimates can only
be made for years before 2010, since the estimates after 2010 are not available for
most studies except for Xia et al. (2016) and the MEIC inventory (the Multiple
Emission Inventory in China, http://www.meicmodel.org). In general, estimates of
Fig. 14.2 The annual emissions estimated by different studies in China from 2000 to 2014
(EDGAR and MEIC indicate the Emissions Database for Global Atmospheric Research and the
Multiple Emission Inventory in China, respectively). (This figure was adapted from Li et al. (2017b)
under Creative Commons Attribution License)
320
Y. Zhao and Y. Xia
studies compared to those for SO 2 . EDGAR has relatively smaller estimations than
other studies. Before 2011, the growth of energy consumption dominated NO X
emissions. Most studies indicated that the emissions reached peak around 30 Tg in
2011 and decreased after then. For example, the annual NO X emissions are calculated to increase from 11.7 to 29.8 Mt during 2000–2011 and then to decline to
27.7 Mt in 2014 by Xia et al. (2016) (Fig. 14.2b). Reduced emissions resulted largely
from the control measures at coal-fired power plants like the improved use of
SCR/SNCR. In 2010, power and industrial sectors contributed larger fractions to
national SO 2 emissions (41% and 44%, respectively) than NO X (39% and 28%).
Transportation contributed 25% of total NOx emissions but very little to SO 2 .
The emissions in STD by Xia et al. (2016) are illustrated in Fig. 14.2 as well. The
relative differences between annual emissions in PRI and STD ((PRI-STD)/PRI) are
calculated to range 7–16% and 4–8% for SO 2 and NO X during 2012–2014, respectively. SO 2 emissions declined by 19% in STD but only 5% in PRI from 2011 to
2014, implying extra benefits of full implementation of emission standards.
Although the penetration of FGD technology in power sector increased faster during
2005–2010 (Zhao et al. 2014), larger reduction in SO 2 emissions were found in later
years in STD. It resulted mainly from (1) improved operation of FGD in power
plants required by the emission standard (GB13223-2011) and (2) effective controls
in certain other industrial sources after 2010. The NO X emissions declined by 9%
from 2010 to 2014 in STD. Power generation is the sector with the largest difference
between the NO X emissions in the two cases, at 2031 kt (27% relative to PRI) for
2014. The benefits of emission standards are smaller for cement and iron and steel
industry, due partly to later implementation of those standards.
For most cases, the intercomparison between various emission estimates can only
be made for years before 2010, since the estimates after 2010 are not available for
most studies except for Xia et al. (2016) and the MEIC inventory (the Multiple
Emission Inventory in China, http://www.meicmodel.org). In general, estimates of
Fig. 14.2 The annual emissions estimated by different studies in China from 2000 to 2014
(EDGAR and MEIC indicate the Emissions Database for Global Atmospheric Research and the
Multiple Emission Inventory in China, respectively). (This figure was adapted from Li et al. (2017b)
under Creative Commons Attribution License)
320
Y. Zhao and Y. Xia