

period. Similarly, as in the use of organic fertilizer, the percentage of biological N
fixation sharply decreased from 1980 to 2010.
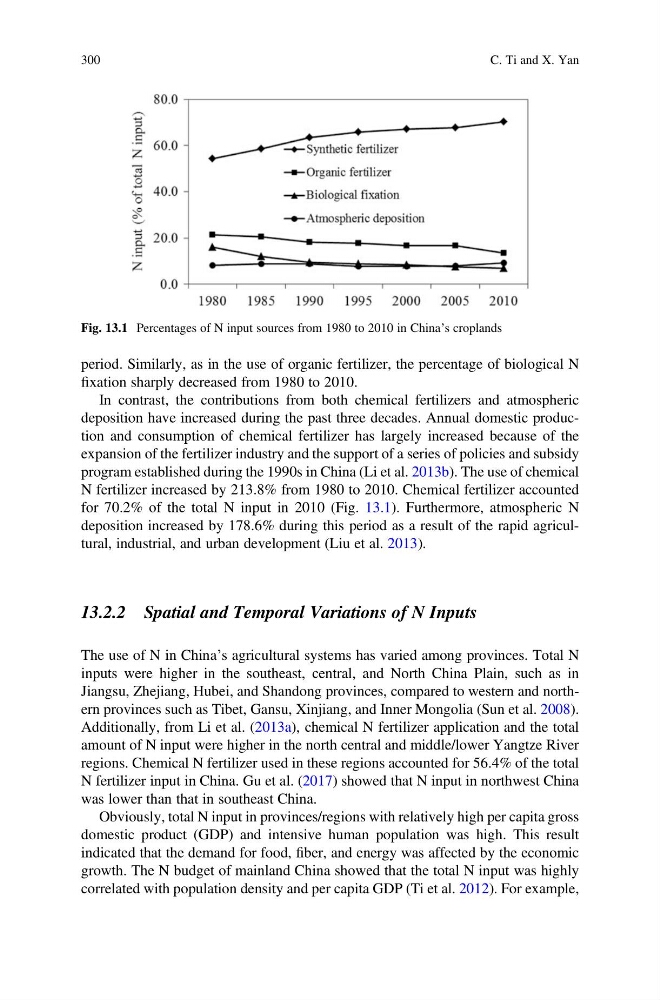
In contrast, the contributions from both chemical fertilizers and atmospheric
deposition have increased during the past three decades. Annual domestic production and consumption of chemical fertilizer has largely increased because of the
expansion of the fertilizer industry and the support of a series of policies and subsidy
program established during the 1990s in China (Li et al. 2013b). The use of chemical
N fertilizer increased by 213.8% from 1980 to 2010. Chemical fertilizer accounted
for 70.2% of the total N input in 2010 (Fig. 13.1). Furthermore, atmospheric N
deposition increased by 178.6% during this period as a result of the rapid agricultural, industrial, and urban development (Liu et al. 2013).
13.2.2 Spatial and Temporal Variations of N Inputs
The use of N in China’s agricultural systems has varied among provinces. Total N
inputs were higher in the southeast, central, and North China Plain, such as in
Jiangsu, Zhejiang, Hubei, and Shandong provinces, compared to western and northern provinces such as Tibet, Gansu, Xinjiang, and Inner Mongolia (Sun et al. 2008).
Additionally, from Li et al. (2013a), chemical N fertilizer application and the total
amount of N input were higher in the north central and middle/lower Yangtze River
regions. Chemical N fertilizer used in these regions accounted for 56.4% of the total
N fertilizer input in China. Gu et al. (2017) showed that N input in northwest China
was lower than that in southeast China.
Obviously, total N input in provinces/regions with relatively high per capita gross
domestic product (GDP) and intensive human population was high. This result
indicated that the demand for food, fiber, and energy was affected by the economic
growth. The N budget of mainland China showed that the total N input was highly
correlated with population density and per capita GDP (Ti et al. 2012). For example,
Fig. 13.1 Percentages of N input sources from 1980 to 2010 in China’s croplands
300
C. Ti and X. Yan
fixation sharply decreased from 1980 to 2010.
In contrast, the contributions from both chemical fertilizers and atmospheric
deposition have increased during the past three decades. Annual domestic production and consumption of chemical fertilizer has largely increased because of the
expansion of the fertilizer industry and the support of a series of policies and subsidy
program established during the 1990s in China (Li et al. 2013b). The use of chemical
N fertilizer increased by 213.8% from 1980 to 2010. Chemical fertilizer accounted
for 70.2% of the total N input in 2010 (Fig. 13.1). Furthermore, atmospheric N
deposition increased by 178.6% during this period as a result of the rapid agricultural, industrial, and urban development (Liu et al. 2013).
13.2.2 Spatial and Temporal Variations of N Inputs
The use of N in China’s agricultural systems has varied among provinces. Total N
inputs were higher in the southeast, central, and North China Plain, such as in
Jiangsu, Zhejiang, Hubei, and Shandong provinces, compared to western and northern provinces such as Tibet, Gansu, Xinjiang, and Inner Mongolia (Sun et al. 2008).
Additionally, from Li et al. (2013a), chemical N fertilizer application and the total
amount of N input were higher in the north central and middle/lower Yangtze River
regions. Chemical N fertilizer used in these regions accounted for 56.4% of the total
N fertilizer input in China. Gu et al. (2017) showed that N input in northwest China
was lower than that in southeast China.
Obviously, total N input in provinces/regions with relatively high per capita gross
domestic product (GDP) and intensive human population was high. This result
indicated that the demand for food, fiber, and energy was affected by the economic
growth. The N budget of mainland China showed that the total N input was highly
correlated with population density and per capita GDP (Ti et al. 2012). For example,
Fig. 13.1 Percentages of N input sources from 1980 to 2010 in China’s croplands
300
C. Ti and X. Yan