

agricultural systems in China must be addressed. Studies regarding the application of
N fertilizer and its contributions to environmental pollution could support basic
information for N regulation (Reis et al. 2016). Therefore, from this view, we
(1) gave an overview of N use and fates in China; (2) analyzed methods to improve
NUE in China’s agricultural systems; and (3) summarized the effects of practices on
mitigating N loss and provided possible recommendations for future agricultural N
regulation in China.
13.2 Nitrogen Use in China’s Agricultural Systems
13.2.1 Nitrogen Input to China’s Agricultural System
Major N input to China’s agricultural system includes synthetic N such as urea and
compound fertilizer and non-synthetic N such as biological fixation, atmospheric
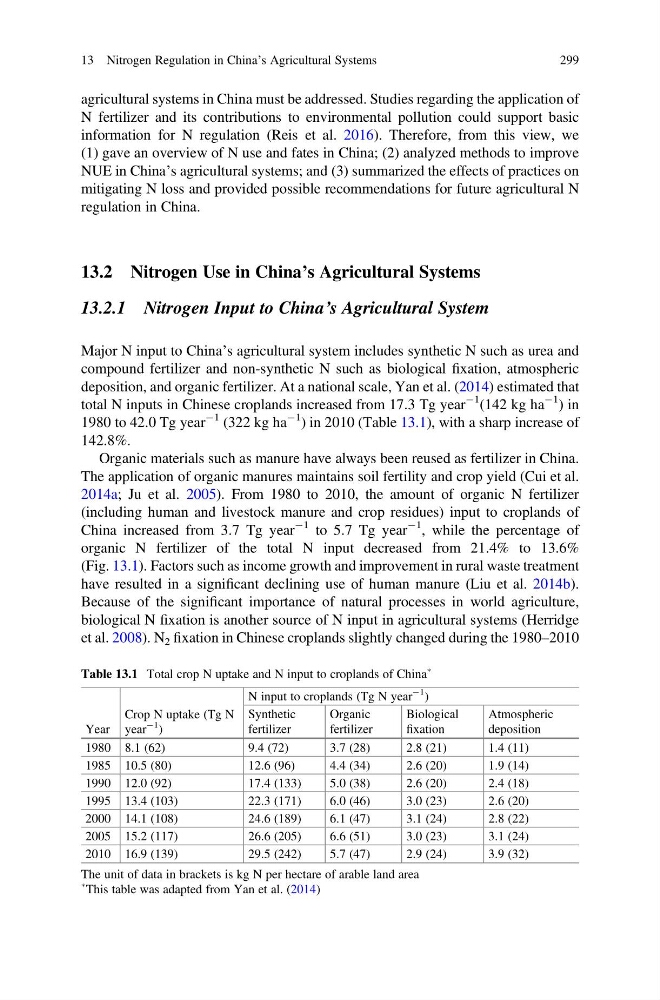
deposition, and organic fertilizer. At a national scale, Yan et al. (2014) estimated that
total N inputs in Chinese croplands increased from 17.3 Tg year
À1 (142 kg ha
À1 ) in
1980 to 42.0 Tg year
À1 (322 kg ha
À1 ) in 2010 (Table 13.1), with a sharp increase of
142.8%.
Organic materials such as manure have always been reused as fertilizer in China.
The application of organic manures maintains soil fertility and crop yield (Cui et al.
2014a; Ju et al. 2005). From 1980 to 2010, the amount of organic N fertilizer
(including human and livestock manure and crop residues) input to croplands of
China increased from 3.7 Tg year
À1 to 5.7 Tg year
À1 , while the percentage of
organic N fertilizer of the total N input decreased from 21.4% to 13.6%
(Fig. 13.1). Factors such as income growth and improvement in rural waste treatment
have resulted in a significant declining use of human manure (Liu et al. 2014b).
Because of the significant importance of natural processes in world agriculture,
biological N fixation is another source of N input in agricultural systems (Herridge
et al. 2008). N 2 fixation in Chinese croplands slightly changed during the 1980–2010
Table 13.1 Total crop N uptake and N input to croplands of China
Ã
Year
Crop N uptake (Tg N
year
À1
)
N input to croplands (Tg N year
À1
)
Synthetic
fertilizer
Organic
fertilizer
Biological
fixation
Atmospheric
deposition
1980 8.1 (62)
9.4 (72)
3.7 (28)
2.8 (21)
1.4 (11)
1985 10.5 (80)
12.6 (96)
4.4 (34)
2.6 (20)
1.9 (14)
1990 12.0 (92)
17.4 (133)
5.0 (38)
2.6 (20)
2.4 (18)
1995 13.4 (103)
22.3 (171)
6.0 (46)
3.0 (23)
2.6 (20)
2000 14.1 (108)
24.6 (189)
6.1 (47)
3.1 (24)
2.8 (22)
2005 15.2 (117)
26.6 (205)
6.6 (51)
3.0 (23)
3.1 (24)
2010 16.9 (139)
29.5 (242)
5.7 (47)
2.9 (24)
3.9 (32)
The unit of data in brackets is kg N per hectare of arable land area
Ã
This table was adapted from Yan et al. (2014)
13 Nitrogen Regulation in China’s Agricultural Systems
299
N fertilizer and its contributions to environmental pollution could support basic
information for N regulation (Reis et al. 2016). Therefore, from this view, we
(1) gave an overview of N use and fates in China; (2) analyzed methods to improve
NUE in China’s agricultural systems; and (3) summarized the effects of practices on
mitigating N loss and provided possible recommendations for future agricultural N
regulation in China.
13.2 Nitrogen Use in China’s Agricultural Systems
13.2.1 Nitrogen Input to China’s Agricultural System
Major N input to China’s agricultural system includes synthetic N such as urea and
compound fertilizer and non-synthetic N such as biological fixation, atmospheric
deposition, and organic fertilizer. At a national scale, Yan et al. (2014) estimated that
total N inputs in Chinese croplands increased from 17.3 Tg year
À1 (142 kg ha
À1 ) in
1980 to 42.0 Tg year
À1 (322 kg ha
À1 ) in 2010 (Table 13.1), with a sharp increase of
142.8%.
Organic materials such as manure have always been reused as fertilizer in China.
The application of organic manures maintains soil fertility and crop yield (Cui et al.
2014a; Ju et al. 2005). From 1980 to 2010, the amount of organic N fertilizer
(including human and livestock manure and crop residues) input to croplands of
China increased from 3.7 Tg year
À1 to 5.7 Tg year
À1 , while the percentage of
organic N fertilizer of the total N input decreased from 21.4% to 13.6%
(Fig. 13.1). Factors such as income growth and improvement in rural waste treatment
have resulted in a significant declining use of human manure (Liu et al. 2014b).
Because of the significant importance of natural processes in world agriculture,
biological N fixation is another source of N input in agricultural systems (Herridge
et al. 2008). N 2 fixation in Chinese croplands slightly changed during the 1980–2010
Table 13.1 Total crop N uptake and N input to croplands of China
Ã
Year
Crop N uptake (Tg N
year
À1
)
N input to croplands (Tg N year
À1
)
Synthetic
fertilizer
Organic
fertilizer
Biological
fixation
Atmospheric
deposition
1980 8.1 (62)
9.4 (72)
3.7 (28)
2.8 (21)
1.4 (11)
1985 10.5 (80)
12.6 (96)
4.4 (34)
2.6 (20)
1.9 (14)
1990 12.0 (92)
17.4 (133)
5.0 (38)
2.6 (20)
2.4 (18)
1995 13.4 (103)
22.3 (171)
6.0 (46)
3.0 (23)
2.6 (20)
2000 14.1 (108)
24.6 (189)
6.1 (47)
3.1 (24)
2.8 (22)
2005 15.2 (117)
26.6 (205)
6.6 (51)
3.0 (23)
3.1 (24)
2010 16.9 (139)
29.5 (242)
5.7 (47)
2.9 (24)
3.9 (32)
The unit of data in brackets is kg N per hectare of arable land area
Ã
This table was adapted from Yan et al. (2014)
13 Nitrogen Regulation in China’s Agricultural Systems
299