

industrialized and urbanized area in China (Paerl et al. 2011; Xu et al. 2010).
Cyanobacterial blooms in Lake Taihu occurred at the end of April 2007 and had
crucial impacts on the livelihoods of millions of local people, especially through
effects on drinking poor quality water (Liu et al. 2011; Luo et al. 2007). Observations indicated that annual bulk deposition rates of total N and total P during 2007 in
Lake Taihu were estimated to be 30 kg N ha
À1 and 0.84 kg P ha
À1 , providing
substantial nutrient inputs necessary for cyanobacterial blooms in northern Lake
Taihu during summer and autumn (Liu et al. 2011, Luo et al. 2007).
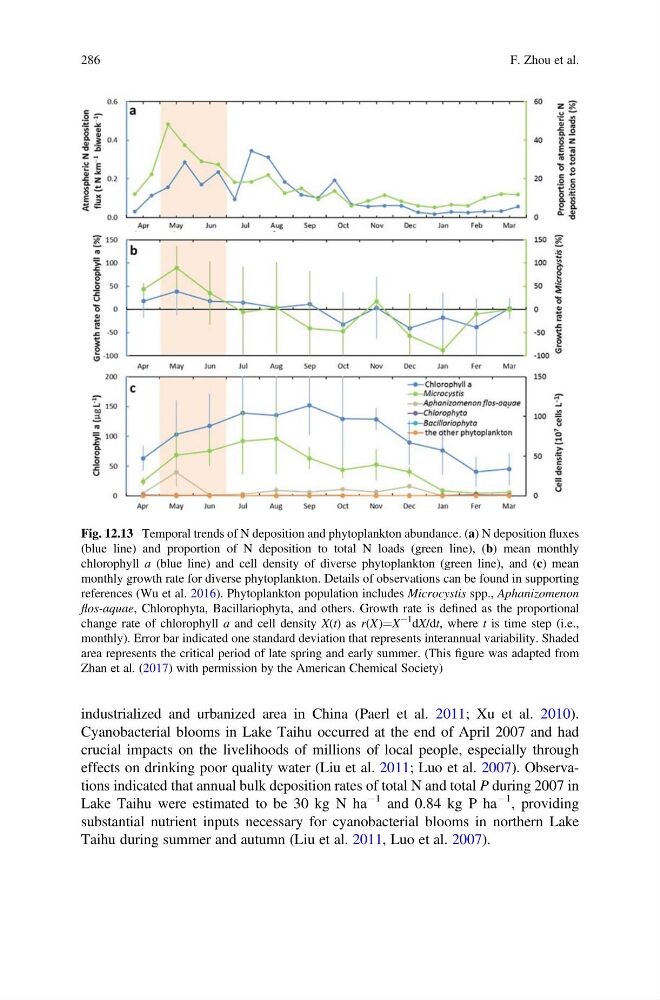
Fig. 12.13 Temporal trends of N deposition and phytoplankton abundance. (a) N deposition fluxes
(blue line) and proportion of N deposition to total N loads (green line), (b) mean monthly
chlorophyll a (blue line) and cell density of diverse phytoplankton (green line), and (c) mean
monthly growth rate for diverse phytoplankton. Details of observations can be found in supporting
references (Wu et al. 2016). Phytoplankton population includes Microcystis spp., Aphanizomenon
flos-aquae, Chlorophyta, Bacillariophyta, and others. Growth rate is defined as the proportional
change rate of chlorophyll a and cell density X(t) as r(X)¼X
À1
dX/dt, where t is time step (i.e.,
monthly). Error bar indicated one standard deviation that represents interannual variability. Shaded
area represents the critical period of late spring and early summer. (This figure was adapted from
Zhan et al. (2017) with permission by the American Chemical Society)
286
F. Zhou et al.
Cyanobacterial blooms in Lake Taihu occurred at the end of April 2007 and had
crucial impacts on the livelihoods of millions of local people, especially through
effects on drinking poor quality water (Liu et al. 2011; Luo et al. 2007). Observations indicated that annual bulk deposition rates of total N and total P during 2007 in
Lake Taihu were estimated to be 30 kg N ha
À1 and 0.84 kg P ha
À1 , providing
substantial nutrient inputs necessary for cyanobacterial blooms in northern Lake
Taihu during summer and autumn (Liu et al. 2011, Luo et al. 2007).
Fig. 12.13 Temporal trends of N deposition and phytoplankton abundance. (a) N deposition fluxes
(blue line) and proportion of N deposition to total N loads (green line), (b) mean monthly
chlorophyll a (blue line) and cell density of diverse phytoplankton (green line), and (c) mean
monthly growth rate for diverse phytoplankton. Details of observations can be found in supporting
references (Wu et al. 2016). Phytoplankton population includes Microcystis spp., Aphanizomenon
flos-aquae, Chlorophyta, Bacillariophyta, and others. Growth rate is defined as the proportional
change rate of chlorophyll a and cell density X(t) as r(X)¼X
À1
dX/dt, where t is time step (i.e.,
monthly). Error bar indicated one standard deviation that represents interannual variability. Shaded
area represents the critical period of late spring and early summer. (This figure was adapted from
Zhan et al. (2017) with permission by the American Chemical Society)
286
F. Zhou et al.