

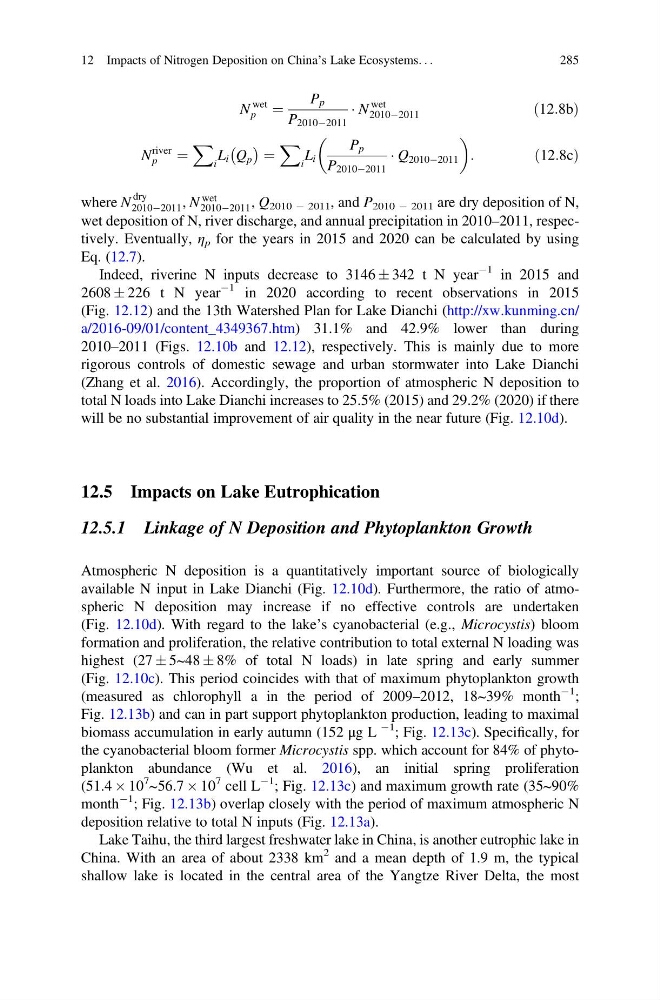
N
wet
p
¼
P p
P 2010À2011
Á N
wet
2010À2011
ð12:8bÞ
N
river
p
¼
X
i
L i Q p
À Á ¼
X
i
L i
P p
P 2010À2011
Á Q 2010À2011
:
ð12:8cÞ
where N
dry
2010À2011 , N
wet
2010À2011 , Q 2010 À 2011 , and P 2010 À 2011 are dry deposition of N,
wet deposition of N, river discharge, and annual precipitation in 2010–2011, respectively. Eventually, η p for the years in 2015 and 2020 can be calculated by using
Eq. (12.7).
Indeed, riverine N inputs decrease to 3146 Æ 342 t N year
À1 in 2015 and
2608 Æ 226 t N year
À1 in 2020 according to recent observations in 2015
(Fig. 12.12) and the 13th Watershed Plan for Lake Dianchi (http://xw.kunming.cn/
a/2016-09/01/content_4349367.htm) 31.1% and 42.9% lower than during
2010–2011 (Figs. 12.10b and 12.12), respectively. This is mainly due to more
rigorous controls of domestic sewage and urban stormwater into Lake Dianchi
(Zhang et al. 2016). Accordingly, the proportion of atmospheric N deposition to
total N loads into Lake Dianchi increases to 25.5% (2015) and 29.2% (2020) if there
will be no substantial improvement of air quality in the near future (Fig. 12.10d).
12.5 Impacts on Lake Eutrophication
12.5.1 Linkage of N Deposition and Phytoplankton Growth
Atmospheric N deposition is a quantitatively important source of biologically
available N input in Lake Dianchi (Fig. 12.10d). Furthermore, the ratio of atmospheric N deposition may increase if no effective controls are undertaken
(Fig. 12.10d). With regard to the lake’s cyanobacterial (e.g., Microcystis) bloom
formation and proliferation, the relative contribution to total external N loading was
highest (27 Æ 5~48 Æ 8% of total N loads) in late spring and early summer
(Fig. 12.10c). This period coincides with that of maximum phytoplankton growth
(measured as chlorophyll a in the period of 2009–2012, 18~39% month
À1 ;
Fig. 12.13b) and can in part support phytoplankton production, leading to maximal
biomass accumulation in early autumn (152 μg L
À1 ; Fig. 12.13c). Specifically, for
the cyanobacterial bloom former Microcystis spp. which account for 84% of phytoplankton abundance (Wu et al. 2016), an initial spring proliferation
(51.4 Â 10
7 ~56.7 Â 10
7 cell L
À1 ; Fig. 12.13c) and maximum growth rate (35~90%
month
À1 ; Fig. 12.13b) overlap closely with the period of maximum atmospheric N
deposition relative to total N inputs (Fig. 12.13a).
Lake Taihu, the third largest freshwater lake in China, is another eutrophic lake in
China. With an area of about 2338 km
2 and a mean depth of 1.9 m, the typical
shallow lake is located in the central area of the Yangtze River Delta, the most
12 Impacts of Nitrogen Deposition on China’s Lake Ecosystems. . .
285
wet
p
¼
P p
P 2010À2011
Á N
wet
2010À2011
ð12:8bÞ
N
river
p
¼
X
i
L i Q p
À Á ¼
X
i
L i
P p
P 2010À2011
Á Q 2010À2011
:
ð12:8cÞ
where N
dry
2010À2011 , N
wet
2010À2011 , Q 2010 À 2011 , and P 2010 À 2011 are dry deposition of N,
wet deposition of N, river discharge, and annual precipitation in 2010–2011, respectively. Eventually, η p for the years in 2015 and 2020 can be calculated by using
Eq. (12.7).
Indeed, riverine N inputs decrease to 3146 Æ 342 t N year
À1 in 2015 and
2608 Æ 226 t N year
À1 in 2020 according to recent observations in 2015
(Fig. 12.12) and the 13th Watershed Plan for Lake Dianchi (http://xw.kunming.cn/
a/2016-09/01/content_4349367.htm) 31.1% and 42.9% lower than during
2010–2011 (Figs. 12.10b and 12.12), respectively. This is mainly due to more
rigorous controls of domestic sewage and urban stormwater into Lake Dianchi
(Zhang et al. 2016). Accordingly, the proportion of atmospheric N deposition to
total N loads into Lake Dianchi increases to 25.5% (2015) and 29.2% (2020) if there
will be no substantial improvement of air quality in the near future (Fig. 12.10d).
12.5 Impacts on Lake Eutrophication
12.5.1 Linkage of N Deposition and Phytoplankton Growth
Atmospheric N deposition is a quantitatively important source of biologically
available N input in Lake Dianchi (Fig. 12.10d). Furthermore, the ratio of atmospheric N deposition may increase if no effective controls are undertaken
(Fig. 12.10d). With regard to the lake’s cyanobacterial (e.g., Microcystis) bloom
formation and proliferation, the relative contribution to total external N loading was
highest (27 Æ 5~48 Æ 8% of total N loads) in late spring and early summer
(Fig. 12.10c). This period coincides with that of maximum phytoplankton growth
(measured as chlorophyll a in the period of 2009–2012, 18~39% month
À1 ;
Fig. 12.13b) and can in part support phytoplankton production, leading to maximal
biomass accumulation in early autumn (152 μg L
À1 ; Fig. 12.13c). Specifically, for
the cyanobacterial bloom former Microcystis spp. which account for 84% of phytoplankton abundance (Wu et al. 2016), an initial spring proliferation
(51.4 Â 10
7 ~56.7 Â 10
7 cell L
À1 ; Fig. 12.13c) and maximum growth rate (35~90%
month
À1 ; Fig. 12.13b) overlap closely with the period of maximum atmospheric N
deposition relative to total N inputs (Fig. 12.13a).
Lake Taihu, the third largest freshwater lake in China, is another eutrophic lake in
China. With an area of about 2338 km
2 and a mean depth of 1.9 m, the typical
shallow lake is located in the central area of the Yangtze River Delta, the most
12 Impacts of Nitrogen Deposition on China’s Lake Ecosystems. . .
285