

contributed 57% for the Caohai portion. In addition, riverine inputs of NO 3
À -N
accounted for 20% and 6% for the Waihai and Caohai portions, respectively.
12.4 Impacts on Lake N Budget
12.4.1 Contribution of N Deposition to Lake N Budget
The mean proportion of atmospheric N deposition to total N loads (i.e., sum of
atmospheric deposition and riverine inputs) was 16.0 Æ 0.8% for the period
2010–2011 (Fig. 12.10a). Such value is non-negligible in watershed assessment of
diverse N sources. The standard deviation due to uncertainties from deposition
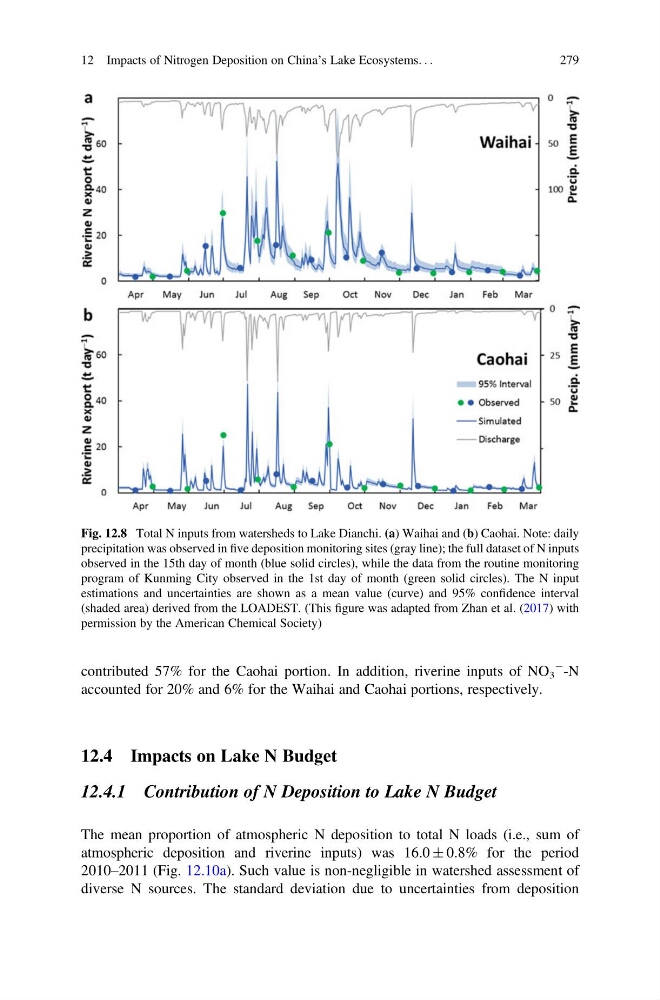
Fig. 12.8 Total N inputs from watersheds to Lake Dianchi. (a) Waihai and (b) Caohai. Note: daily
precipitation was observed in five deposition monitoring sites (gray line); the full dataset of N inputs
observed in the 15th day of month (blue solid circles), while the data from the routine monitoring
program of Kunming City observed in the 1st day of month (green solid circles). The N input
estimations and uncertainties are shown as a mean value (curve) and 95% confidence interval
(shaded area) derived from the LOADEST. (This figure was adapted from Zhan et al. (2017) with
permission by the American Chemical Society)
12 Impacts of Nitrogen Deposition on China’s Lake Ecosystems. . .
279
À -N
accounted for 20% and 6% for the Waihai and Caohai portions, respectively.
12.4 Impacts on Lake N Budget
12.4.1 Contribution of N Deposition to Lake N Budget
The mean proportion of atmospheric N deposition to total N loads (i.e., sum of
atmospheric deposition and riverine inputs) was 16.0 Æ 0.8% for the period
2010–2011 (Fig. 12.10a). Such value is non-negligible in watershed assessment of
diverse N sources. The standard deviation due to uncertainties from deposition
Fig. 12.8 Total N inputs from watersheds to Lake Dianchi. (a) Waihai and (b) Caohai. Note: daily
precipitation was observed in five deposition monitoring sites (gray line); the full dataset of N inputs
observed in the 15th day of month (blue solid circles), while the data from the routine monitoring
program of Kunming City observed in the 1st day of month (green solid circles). The N input
estimations and uncertainties are shown as a mean value (curve) and 95% confidence interval
(shaded area) derived from the LOADEST. (This figure was adapted from Zhan et al. (2017) with
permission by the American Chemical Society)
12 Impacts of Nitrogen Deposition on China’s Lake Ecosystems. . .
279