

riverine N inputs in this study. The calibrated LOADEST equations in Table 12.2
were run 100,000 times by randomly varying all of the model coefficients given a
normal distributions given by the coefficients of variation (CVs), where uniform
distribution was applied for streamflow. The CV of each model coefficient is
estimated in the calibration process of LOADEST, and the CV of streamflow is
assumed as 0.05. The mean value for N inputs from watersheds (including diffusive
discharge from small creek rather than 19 rivers in Fig. 12.1) to Lake Dianchi was
12.5 Æ 12.2 t day
À1 (1σ as the standard deviation of N inputs occurring in 365 days;
Fig. 12.3), with 8.5 Æ 7.9 t day
À1 for the Waihai and 4.1 Æ 5.3 t day
À1 for the Caohai
segments. N inputs for the Waihai showed large seasonal variability with CV of
0.65, similar with daily discharge. High N inputs were estimated in July, August, and
October, when contributing half of the annual total. In contrast with the Waihai, N
inputs for the Caohai have a lower seasonality (CV ¼ 0.46), because it was primarily
dominated by point sources such as domestic sewages and industrial wastewater.
Similarly, daily riverine inputs of different N constituents were estimated by means
of LOADEST. Figure 12.9 showed that organic N comprised 45% of the total
riverine inputs for the Waihai portion during the period 2010–2011, while NH 4
+ -N
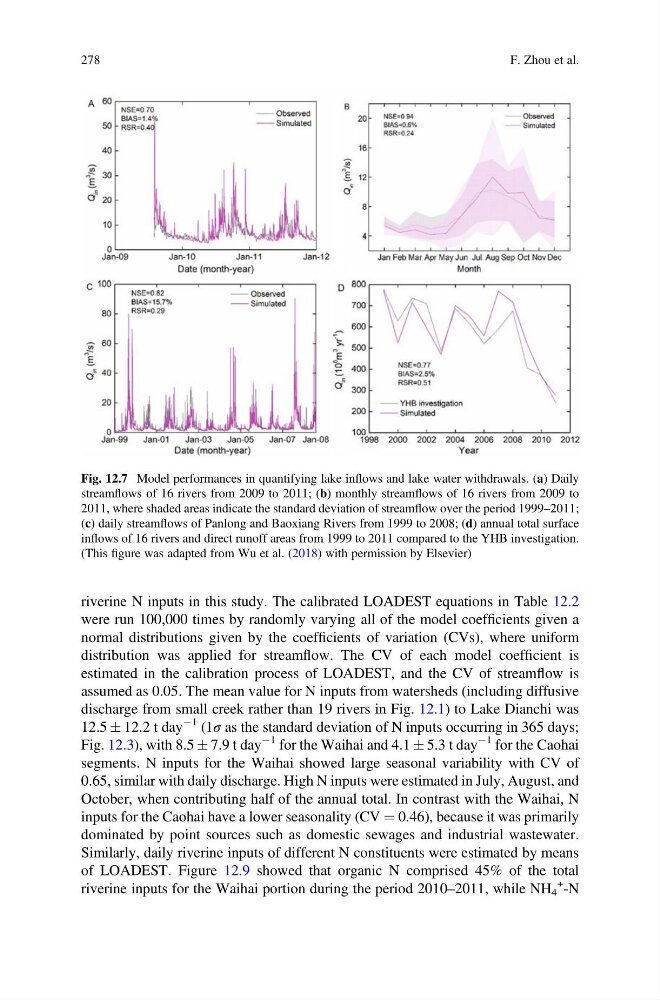
Fig. 12.7 Model performances in quantifying lake inflows and lake water withdrawals. (a) Daily
streamflows of 16 rivers from 2009 to 2011; (b) monthly streamflows of 16 rivers from 2009 to
2011, where shaded areas indicate the standard deviation of streamflow over the period 1999–2011;
(c) daily streamflows of Panlong and Baoxiang Rivers from 1999 to 2008; (d) annual total surface
inflows of 16 rivers and direct runoff areas from 1999 to 2011 compared to the YHB investigation.
(This figure was adapted from Wu et al. (2018) with permission by Elsevier)
278
F. Zhou et al.
were run 100,000 times by randomly varying all of the model coefficients given a
normal distributions given by the coefficients of variation (CVs), where uniform
distribution was applied for streamflow. The CV of each model coefficient is
estimated in the calibration process of LOADEST, and the CV of streamflow is
assumed as 0.05. The mean value for N inputs from watersheds (including diffusive
discharge from small creek rather than 19 rivers in Fig. 12.1) to Lake Dianchi was
12.5 Æ 12.2 t day
À1 (1σ as the standard deviation of N inputs occurring in 365 days;
Fig. 12.3), with 8.5 Æ 7.9 t day
À1 for the Waihai and 4.1 Æ 5.3 t day
À1 for the Caohai
segments. N inputs for the Waihai showed large seasonal variability with CV of
0.65, similar with daily discharge. High N inputs were estimated in July, August, and
October, when contributing half of the annual total. In contrast with the Waihai, N
inputs for the Caohai have a lower seasonality (CV ¼ 0.46), because it was primarily
dominated by point sources such as domestic sewages and industrial wastewater.
Similarly, daily riverine inputs of different N constituents were estimated by means
of LOADEST. Figure 12.9 showed that organic N comprised 45% of the total
riverine inputs for the Waihai portion during the period 2010–2011, while NH 4
+ -N
Fig. 12.7 Model performances in quantifying lake inflows and lake water withdrawals. (a) Daily
streamflows of 16 rivers from 2009 to 2011; (b) monthly streamflows of 16 rivers from 2009 to
2011, where shaded areas indicate the standard deviation of streamflow over the period 1999–2011;
(c) daily streamflows of Panlong and Baoxiang Rivers from 1999 to 2008; (d) annual total surface
inflows of 16 rivers and direct runoff areas from 1999 to 2011 compared to the YHB investigation.
(This figure was adapted from Wu et al. (2018) with permission by Elsevier)
278
F. Zhou et al.