

significant changes, there was a significant trend for pH decline in the soil water
during 2001–2011 according to the long-term observation, responding quickly to the
drop of acid deposition after 2011 (Yu et al. 2017c).
Chronically elevated atmospheric N deposition to terrestrial ecosystems can
cause the acidification of soil (Van Breemen et al. 1984; Larssen and Carmichael
2000; Huang et al. 2015). Combined with the increasing N deposition, N transformations have critical contribution to the acidification of soils (H
+
N in keq ha
À1
year
À1 ), which can be quantified according to Formula 8.2 (Van Breemen et al.
1984):
H
þ
N ¼ NH 4
þ
i À NH 4
þ
o
ð
Þ þNO 3
À
o À NO 3
À
i
ð
Þ
ð 8:2Þ
where NH 4
+
i and NO 3
À
i are the fluxes of NH 4
+ and NO 3
À in throughfall, respectively, while NH 4
+
o and NO 3
À
o are fluxes of NH 4
+ and NO 3
À leaching in soil water.
According to the study at Tieshanping forested site (Fig. 8.8), the acid input by N
transformations (H
+
N ¼ 3.03 keq ha
À1 year
À1 ) greatly exceeded the H
+ input
directly by atmospheric deposition (1.91 keq ha
À1 year
À1 ). The acid input by N
transformations (H
+
N ) contributed more to total acid input with the increase in
contribution of nitrogen to acid deposition from 2001 to 2013 at Tieshanping
(Fig. 8.8). According to the calculation of compiled data from several studies in
forests (Fig. 8.9a), H
+
N have distinctly increased when the N deposition is larger than
36 kg N ha
À1 year
À1 . It indicated that N deposition to terrestrial ecosystems could
lead to significant acid input to the soil, especially when the N deposition was larger
than 36 kg N ha
À1 year
À1 .
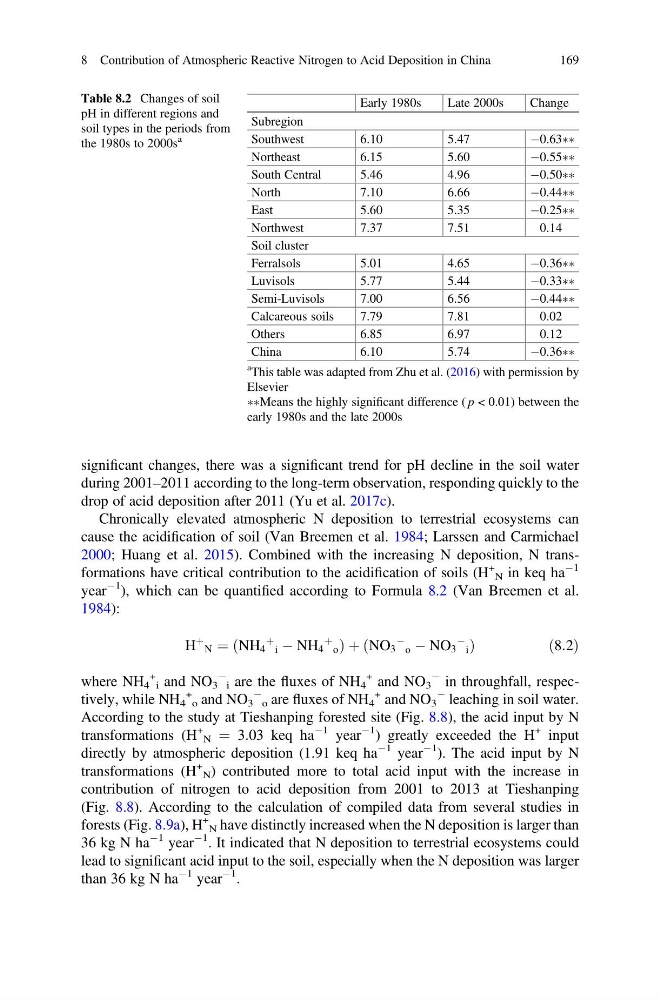
Table 8.2 Changes of soil
pH in different regions and
soil types in the periods from
the 1980s to 2000s
a
Early 1980s
Late 2000s
Change
Subregion
Southwest
6.10
5.47
À0.63ÃÃ
Northeast
6.15
5.60
À0.55ÃÃ
South Central
5.46
4.96
À0.50ÃÃ
North
7.10
6.66
À0.44ÃÃ
East
5.60
5.35
À0.25ÃÃ
Northwest
7.37
7.51
0.14
Soil cluster
Ferralsols
5.01
4.65
À0.36ÃÃ
Luvisols
5.77
5.44
À0.33ÃÃ
Semi-Luvisols
7.00
6.56
À0.44ÃÃ
Calcareous soils
7.79
7.81
0.02
Others
6.85
6.97
0.12
China
6.10
5.74
À0.36ÃÃ
a This table was adapted from Zhu et al. (2016) with permission by
Elsevier
ÃÃMeans the highly significant difference ( p < 0.01) between the
early 1980s and the late 2000s
8 Contribution of Atmospheric Reactive Nitrogen to Acid Deposition in China
169
during 2001–2011 according to the long-term observation, responding quickly to the
drop of acid deposition after 2011 (Yu et al. 2017c).
Chronically elevated atmospheric N deposition to terrestrial ecosystems can
cause the acidification of soil (Van Breemen et al. 1984; Larssen and Carmichael
2000; Huang et al. 2015). Combined with the increasing N deposition, N transformations have critical contribution to the acidification of soils (H
+
N in keq ha
À1
year
À1 ), which can be quantified according to Formula 8.2 (Van Breemen et al.
1984):
H
þ
N ¼ NH 4
þ
i À NH 4
þ
o
ð
Þ þNO 3
À
o À NO 3
À
i
ð
Þ
ð 8:2Þ
where NH 4
+
i and NO 3
À
i are the fluxes of NH 4
+ and NO 3
À in throughfall, respectively, while NH 4
+
o and NO 3
À
o are fluxes of NH 4
+ and NO 3
À leaching in soil water.
According to the study at Tieshanping forested site (Fig. 8.8), the acid input by N
transformations (H
+
N ¼ 3.03 keq ha
À1 year
À1 ) greatly exceeded the H
+ input
directly by atmospheric deposition (1.91 keq ha
À1 year
À1 ). The acid input by N
transformations (H
+
N ) contributed more to total acid input with the increase in
contribution of nitrogen to acid deposition from 2001 to 2013 at Tieshanping
(Fig. 8.8). According to the calculation of compiled data from several studies in
forests (Fig. 8.9a), H
+
N have distinctly increased when the N deposition is larger than
36 kg N ha
À1 year
À1 . It indicated that N deposition to terrestrial ecosystems could
lead to significant acid input to the soil, especially when the N deposition was larger
than 36 kg N ha
À1 year
À1 .
Table 8.2 Changes of soil
pH in different regions and
soil types in the periods from
the 1980s to 2000s
a
Early 1980s
Late 2000s
Change
Subregion
Southwest
6.10
5.47
À0.63ÃÃ
Northeast
6.15
5.60
À0.55ÃÃ
South Central
5.46
4.96
À0.50ÃÃ
North
7.10
6.66
À0.44ÃÃ
East
5.60
5.35
À0.25ÃÃ
Northwest
7.37
7.51
0.14
Soil cluster
Ferralsols
5.01
4.65
À0.36ÃÃ
Luvisols
5.77
5.44
À0.33ÃÃ
Semi-Luvisols
7.00
6.56
À0.44ÃÃ
Calcareous soils
7.79
7.81
0.02
Others
6.85
6.97
0.12
China
6.10
5.74
À0.36ÃÃ
a This table was adapted from Zhu et al. (2016) with permission by
Elsevier
ÃÃMeans the highly significant difference ( p < 0.01) between the
early 1980s and the late 2000s
8 Contribution of Atmospheric Reactive Nitrogen to Acid Deposition in China
169